
In the fast-paced world of financial markets, understanding the forces that drive price movement is essential for both novice and seasoned traders. One powerful tool that offers a deeper view into market behavior is market depth. Unlike simple price charts or volume indicators, market depth reveals the actual supply and demand at various price levels in real-time, showing how many buy and sell orders are waiting to be executed. This visibility into the order book allows traders to anticipate how the market might react to large trades, identify potential support and resistance zones, and assess the strength of buying or selling interest. In this article, we’ll explore what market depth is, how it works, and why it plays a critical role in shaping price action across financial assets.
What is Market Depth?
Market depth refers to the market’s ability to absorb large buy or sell orders without causing significant changes in the asset’s price. It represents the range and volume of open buy (bid) and sell (ask) orders at different price levels, typically displayed in an order book on trading platforms. A market with strong depth will have a high number of orders spread across various prices, allowing large transactions to take place with minimal price impact. Conversely, a shallow market has fewer orders, making it more susceptible to price volatility from even modest trades. Market depth is a key indicator of liquidity and stability, giving traders insight into the underlying supply and demand dynamics of a particular asset.
Key Components of Market Depth
To fully understand how market depth reflects buying and selling interest, it’s important to break down its core components. These elements are typically presented in an order book and provide traders with a real-time view of market sentiment and liquidity. By analyzing these details, traders can make informed decisions about when and how to execute their trades.
1. Bid Price: The highest price that buyers are willing to pay for an asset at a given moment.
2. Ask Price: The lowest price at which sellers are willing to sell the asset.
3. Order Size (Quantity): The number of shares, contracts, or units available for buying or selling at a specific price level.
4. Price Levels: The various prices at which buy and sell orders are placed, showing how deep the market is.
5. Cumulative Volume: The total quantity of orders accumulated up to each price level, indicating liquidity strength.
6. Bid-Ask Spread: The difference between the highest bid and lowest ask prices; narrower spreads typically indicate a more liquid market.
7. Number of Orders: The count of individual orders at each price level, reflecting how widespread interest is among market participants.
 How Market Depth Reflects Buying and Selling Interest
Market depth is more than just a snapshot of current prices—it’s a real-time window into trader behavior, showing how much buying and selling pressure exists at different price levels. It reveals whether buyers or sellers are more aggressive, where price barriers may form, and how a market might react to large trades. By analyzing the distribution and size of orders in the order book, traders can anticipate potential price movements, identify imbalances, and make more strategic decisions. Here’s how market depth reveals buying and selling interest in greater detail:
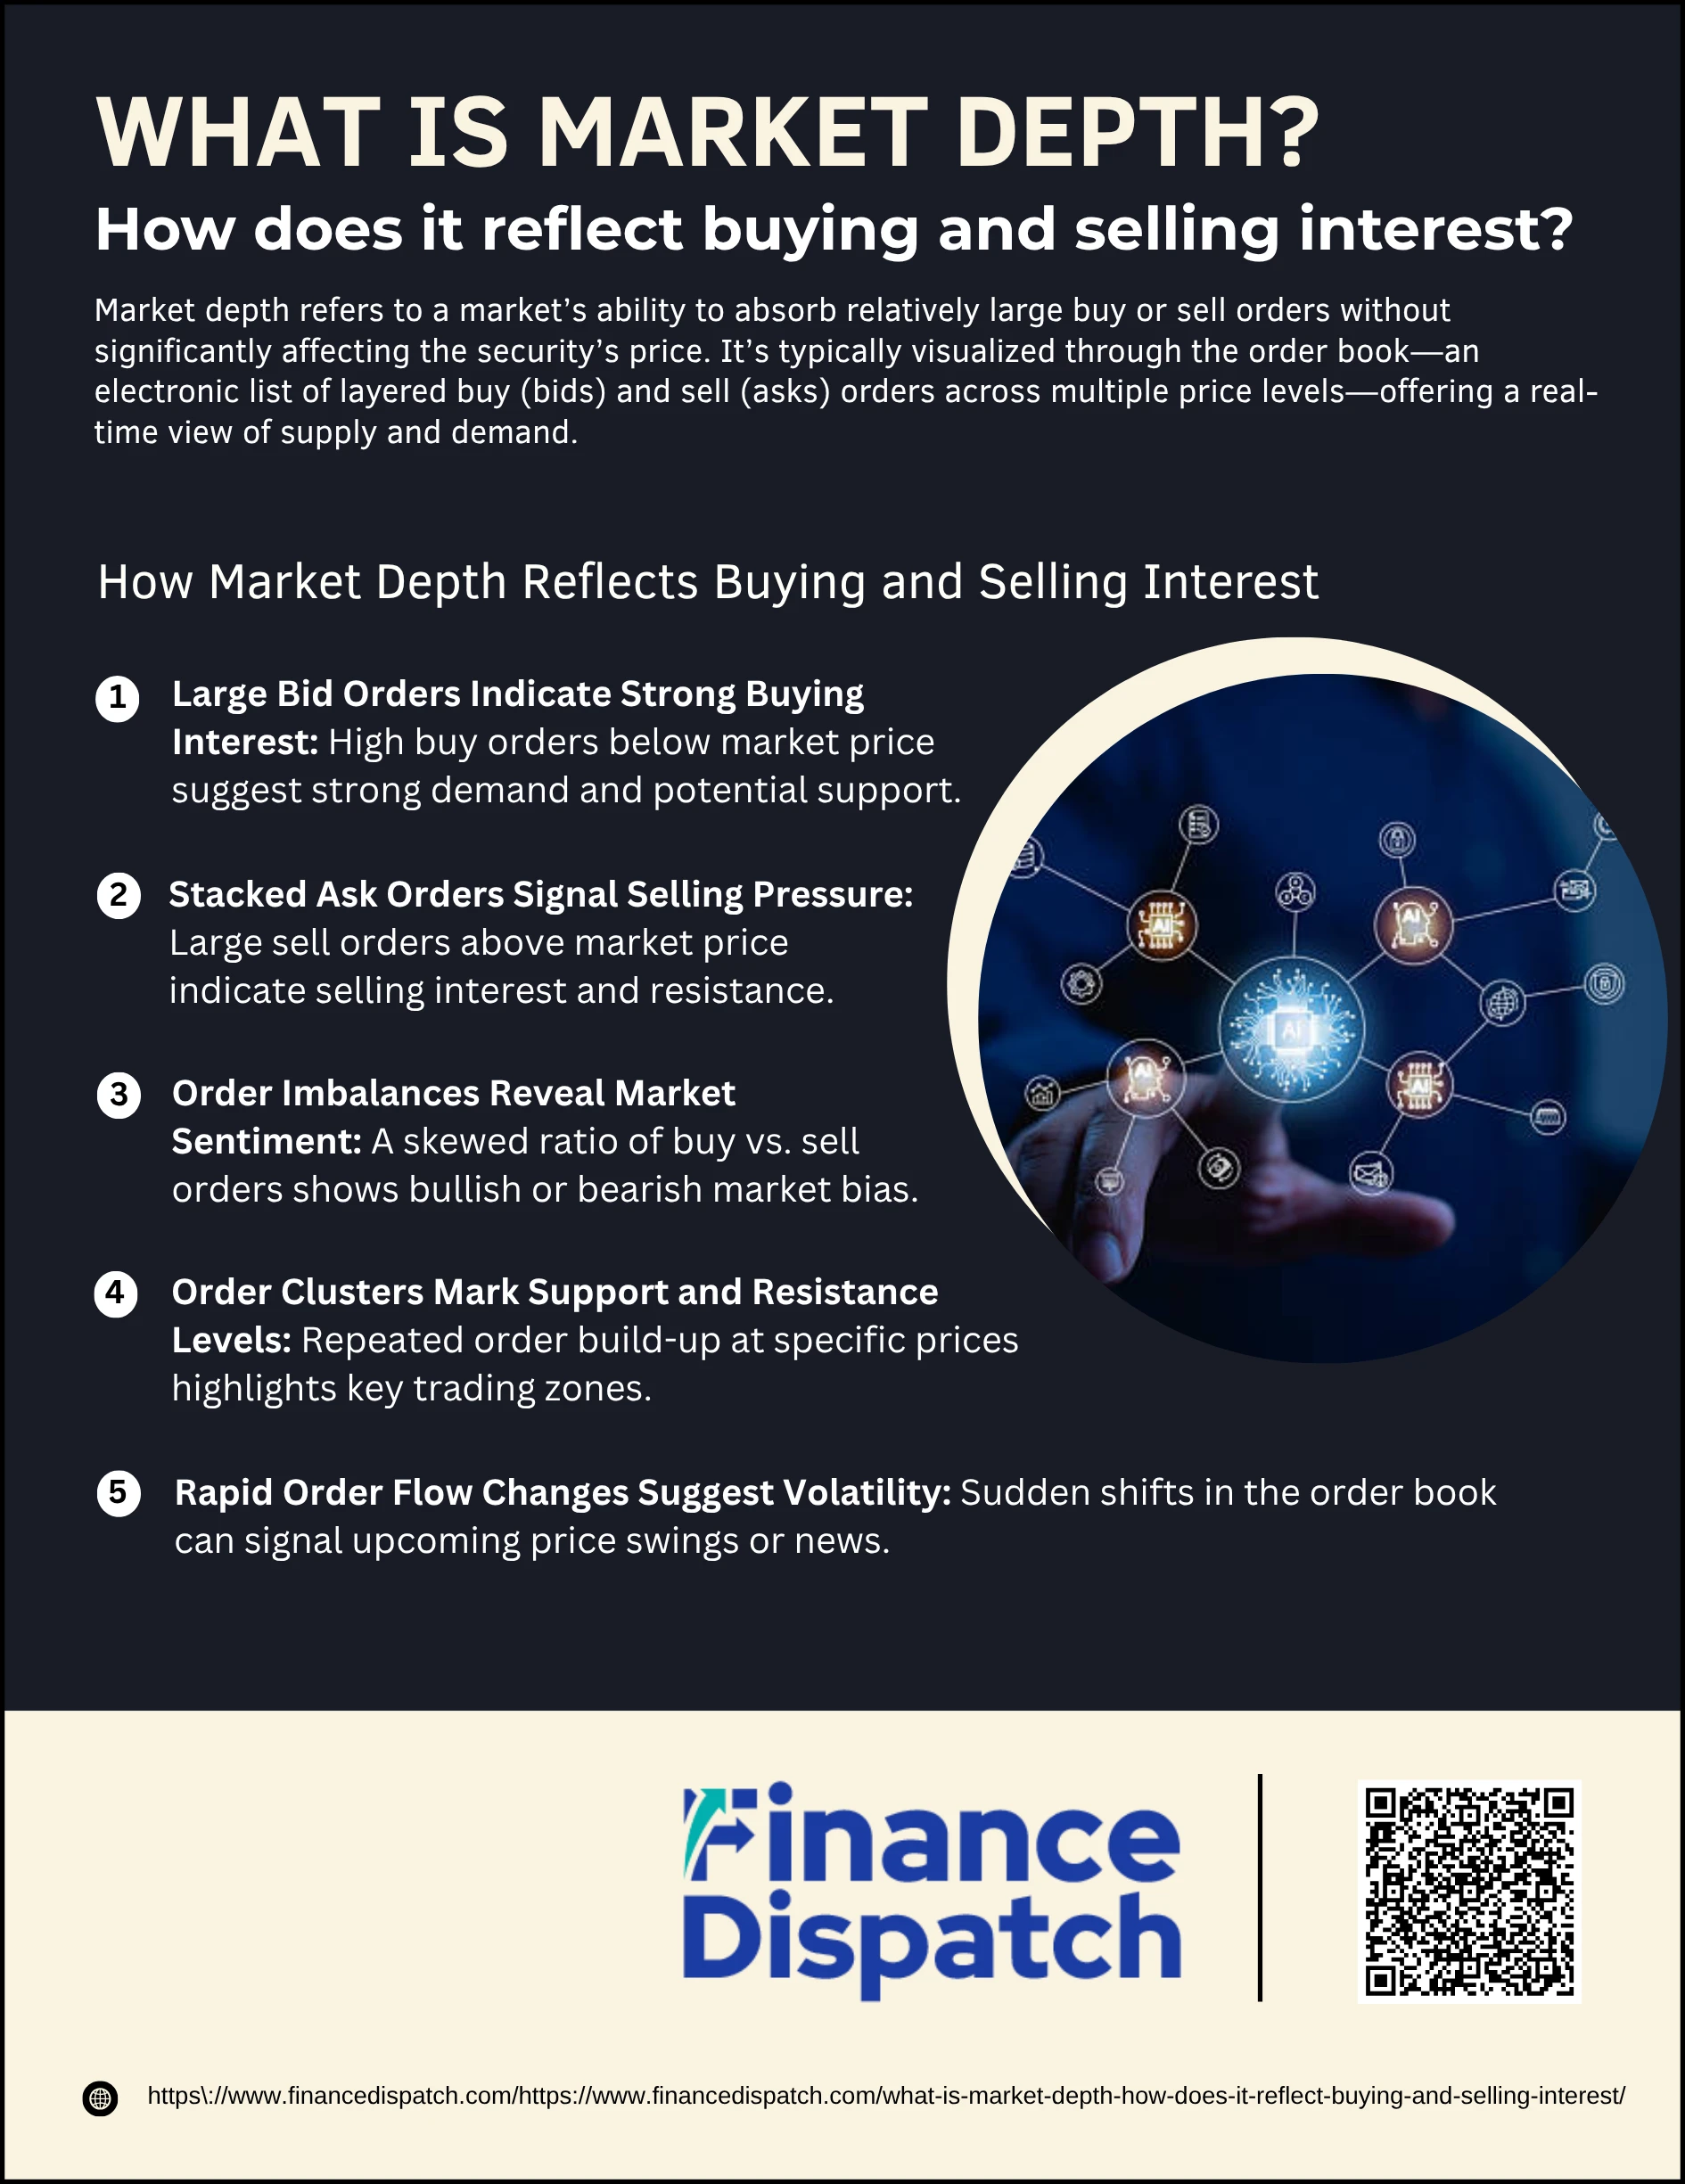
1. Large Bid Orders Indicate Strong Buying Interest
When there are high volumes of buy orders stacked just below the current market price, it suggests traders are confident that the price will rise and are eager to purchase the asset. This creates a cushion of demand, often acting as a support level.
2. Stacked Ask Orders Signal Selling Pressure
A large concentration of sell orders above the current market price shows that many traders are looking to exit their positions. This supply overhead can slow or reverse upward price movement, forming a resistance zone.
3. Order Imbalances Reveal Market Sentiment
If the number and size of buy orders far exceed sell orders, it typically reflects bullish sentiment—traders expect the price to go up. The reverse—a dominance of sell orders—suggests bearish expectations.
4. Order Clusters Mark Support and Resistance Levels
When orders repeatedly build up at certain prices, these levels become psychological thresholds. Buyers or sellers often defend these zones, causing prices to stall or bounce, which traders watch closely for potential entry or exit signals.
5. Rapid Order Flow Changes Suggest Volatility
Sudden changes in the order book—such as fast-appearing or disappearing orders—can hint at upcoming news events or institutional activity. These movements often precede price spikes or drops, alerting traders to increased volatility and risk.
Using Market Depth in Trading Strategies
Market depth is a valuable tool that traders use to fine-tune their entry and exit points, manage risk, and gauge real-time sentiment. It provides a clearer picture of where significant buying or selling interest lies, helping traders anticipate short-term price movements and avoid slippage. By integrating market depth analysis into their strategy, traders can make more informed and precise decisions, especially in fast-moving markets.
1. Scalping Opportunities: Traders use tight bid-ask spreads and visible order flow to execute quick, small-profit trades multiple times throughout the day.
2. Identifying Support and Resistance: Clusters of large bids or asks reveal price levels where price may bounce or reverse, helping define key zones.
3. Order Timing: Observing how quickly orders are filled or canceled helps determine whether to enter immediately or wait for better conditions.
4. Avoiding Slippage: Depth analysis helps traders break large trades into smaller ones to avoid moving the market price.
5. Detecting Market Sentiment Shifts: Sudden imbalances in buy and sell orders can signal a shift in momentum or the arrival of institutional traders.
6. Algorithmic Trading Triggers: Automated trading systems often rely on depth data to execute trades based on predefined conditions like volume clusters or spread tightening.
Market Depth vs. Volume and Liquidity
While market depth, trading volume, and liquidity are often discussed together, they represent different concepts in market analysis. Volume refers to the total number of shares or contracts traded over a specific period, and liquidity measures how easily an asset can be bought or sold without affecting its price. Market depth, on the other hand, reveals the available buy and sell orders at various price levels. An asset can have high volume but shallow depth if most trades are concentrated at just one or two price points. Understanding how these three metrics differ helps traders assess trade execution quality and potential price impact more accurately.
| Aspect | Market Depth | Volume | Liquidity |
| Definition | Number of buy/sell orders at different price levels | Total amount of shares/contracts traded | Ease of buying/selling without large price movement |
| Timeframe | Real-time snapshot of current orders | Measured over a period (e.g., daily volume) | Continuous, based on market structure |
| What it shows | Supply/demand near the current price | Trading activity and investor interest | Efficiency and cost of entering/exiting positions |
| Key Indicator | Bid/ask stack in the order book | Total number of executed trades | Narrow spreads and high order fill rates |
| Trading Use | Helps time entries and exits precisely | Confirms price trends and asset popularity | Reduces slippage and allows for larger orders without impact |
 Benefits and Limitations of Market Depth
Market depth offers traders an edge by revealing the live distribution of buy and sell orders at various price levels, helping them see beyond basic price charts or volume indicators. It acts like a real-time X-ray of market sentiment—showing where buyers are eager to step in and where sellers are looking to exit. This can lead to better trading decisions, improved execution, and more precise risk management. However, it’s not without its challenges. Market depth can sometimes be misleading, manipulated, or simply too fast-moving for some traders to act on effectively. Below is a deeper look at its main advantages and drawbacks:
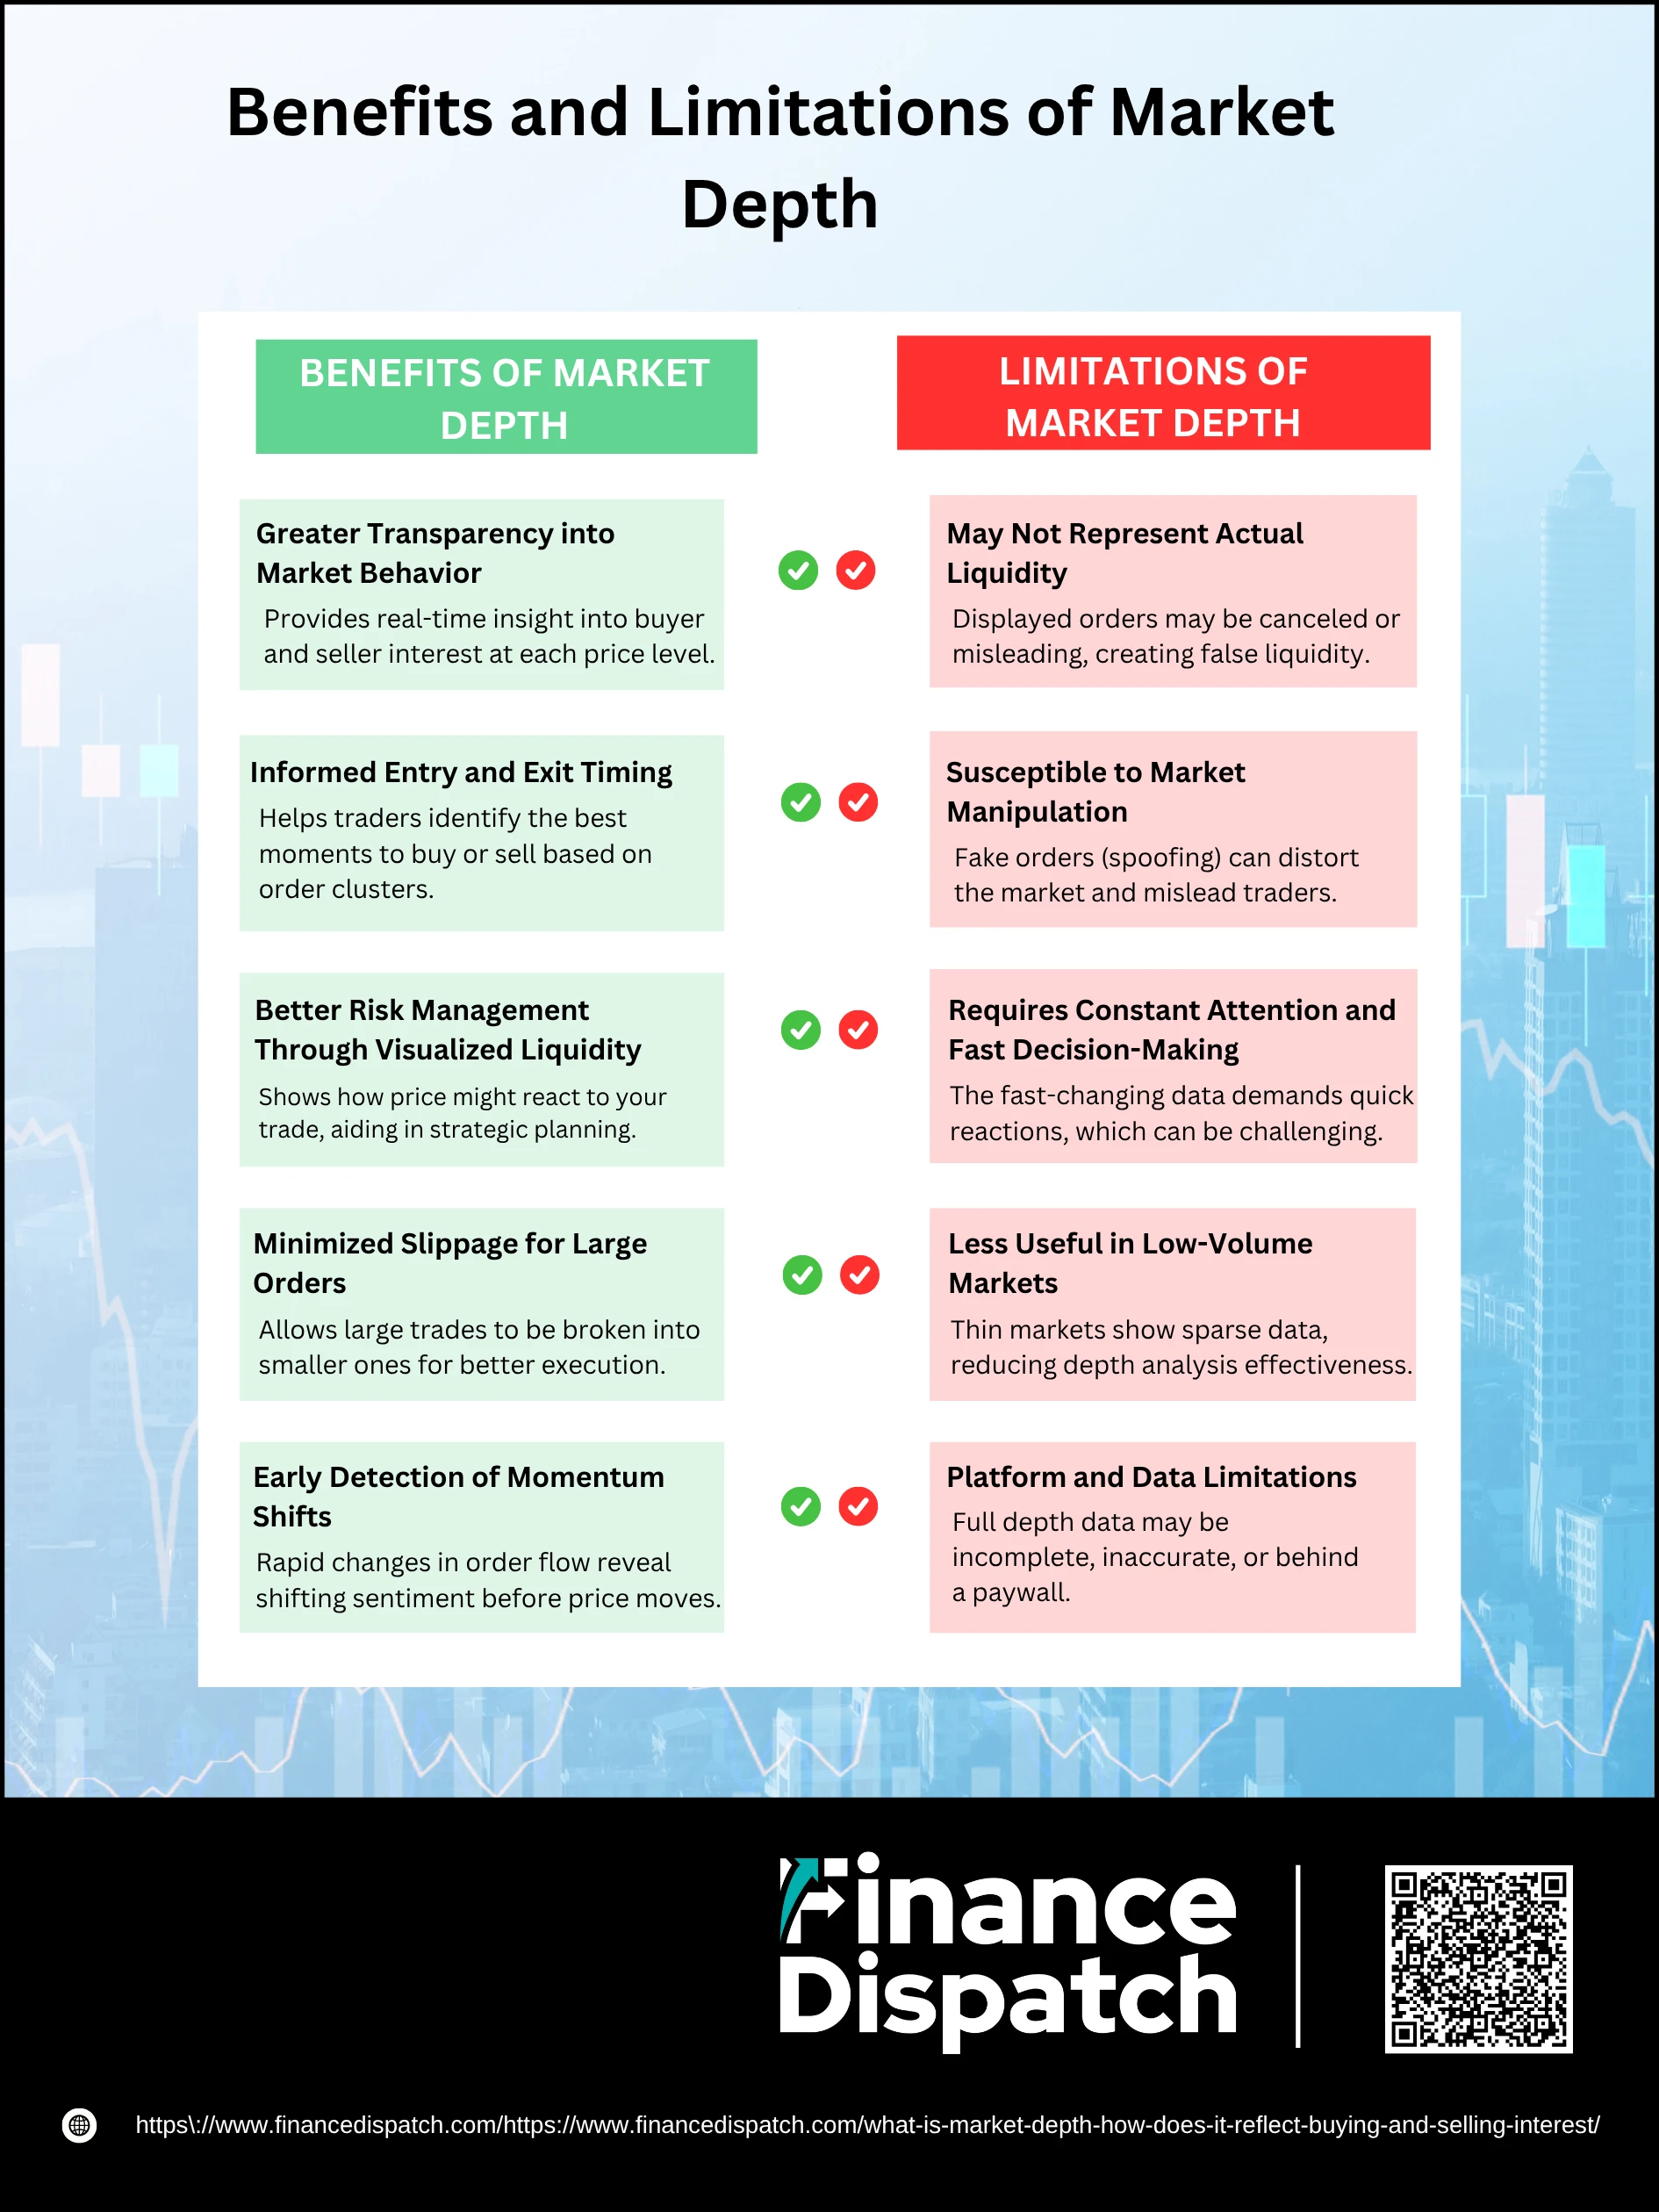
Benefits
1. Greater Transparency into Market Behavior
Market depth allows traders to view open orders in real-time, offering insight into where supply and demand are building. This transparency helps traders understand how other participants are positioning themselves—especially around key price levels.
2. Informed Entry and Exit Timing
By analyzing where large orders are concentrated, traders can anticipate areas of support or resistance and plan entries or exits accordingly—improving trade timing and reducing the chance of unfavorable fills.
3. Better Risk Management Through Visualized Liquidity
Seeing exactly how much buying or selling interest exists at each level helps traders assess how far a price might move in response to their own order, allowing for better placement of stop-losses and profit targets.
4. Minimized Slippage for Large Orders
Instead of placing one large order that moves the market, traders can use market depth to split the order into smaller chunks at different price levels, preserving execution price and reducing slippage.
5. Early Detection of Momentum Shifts
Rapid changes in order volume or sudden cancellations can alert traders to shifts in sentiment. For example, an increasing number of aggressive bids might indicate upward momentum building before it shows up on a price chart.
Limitations
1. May Not Represent Actual Liquidity
Not all orders in the order book are firm commitments—some may be canceled or modified. This can create an illusion of liquidity that disappears when a large trade is placed.
2. Susceptible to Market Manipulation
Some traders, especially high-frequency ones, use spoofing tactics by placing large visible orders they never intend to execute, only to cancel them once price reacts. This can trick less experienced traders into taking losing positions.
3. Requires Constant Attention and Fast Decision-Making
Market depth data changes rapidly—especially in highly volatile markets. Traders must be quick and focused to react in time, which can be overwhelming or impractical for casual or long-term investors.
4. Less Useful in Low-Volume Markets
In thinly traded stocks or markets, the order book may be shallow or sparse, offering limited data and unreliable signals. In such cases, even small orders can cause dramatic price swings, diminishing the effectiveness of depth analysis.
5. Platform and Data Limitations
Access to full-depth (Level 2) data often requires a subscription, and not all brokers or platforms offer complete or accurate information. Relying on incomplete depth data can lead to incorrect assumptions and poor decisions.
Accessing Market Depth Data
Market depth data is typically accessed through trading platforms that provide real-time views of the order book. This data is categorized into two levels: Level 1, which shows the best bid and ask prices along with the last traded price and volume, and Level 2, which offers a more detailed view of multiple price levels above and below the current market price. Level 2 data includes the number of orders and total quantities at each price point, giving a fuller picture of supply and demand. While some brokers and platforms offer basic depth data for free, accessing full Level 2 data often requires a paid subscription or premium account. Traders can view this data through desktop platforms, web terminals, or mobile apps, depending on their broker. Having access to accurate and timely market depth information is essential for those who rely on order flow analysis, high-frequency trading, or scalping strategies, as it helps them make quicker, more precise decisions in a fast-moving market.
Conclusion
Market depth is a critical tool for understanding the real-time dynamics of supply and demand in financial markets. By providing a detailed view of buy and sell orders at various price levels, it helps traders anticipate price movements, identify potential support and resistance zones, and execute trades with greater precision. Unlike simple price charts or volume indicators, market depth reveals the hidden layers of market sentiment, making it especially useful for short-term strategies and active trading. However, its effectiveness depends on accurate data interpretation, platform access, and awareness of its limitations—such as potential manipulation and rapidly changing conditions. When used wisely, market depth can significantly enhance a trader’s ability to make informed, confident decisions in both liquid and volatile markets.