In a globalized economy where currencies and costs vary dramatically from one country to another, comparing economic prosperity and living standards across nations can be challenging. That’s where Purchasing Power Parity (PPP) comes in. PPP is an economic theory that helps equalize the buying power of different currencies by accounting for differences in price levels between countries. Instead of relying solely on fluctuating exchange rates, PPP adjusts for what people can actually buy in their local economies—offering a more accurate way to evaluate wealth, consumption, and the real cost of living. This article explores what PPP is, how it’s calculated, and how it provides a meaningful lens for comparing living standards across borders.
What Is Purchasing Power Parity (PPP)?
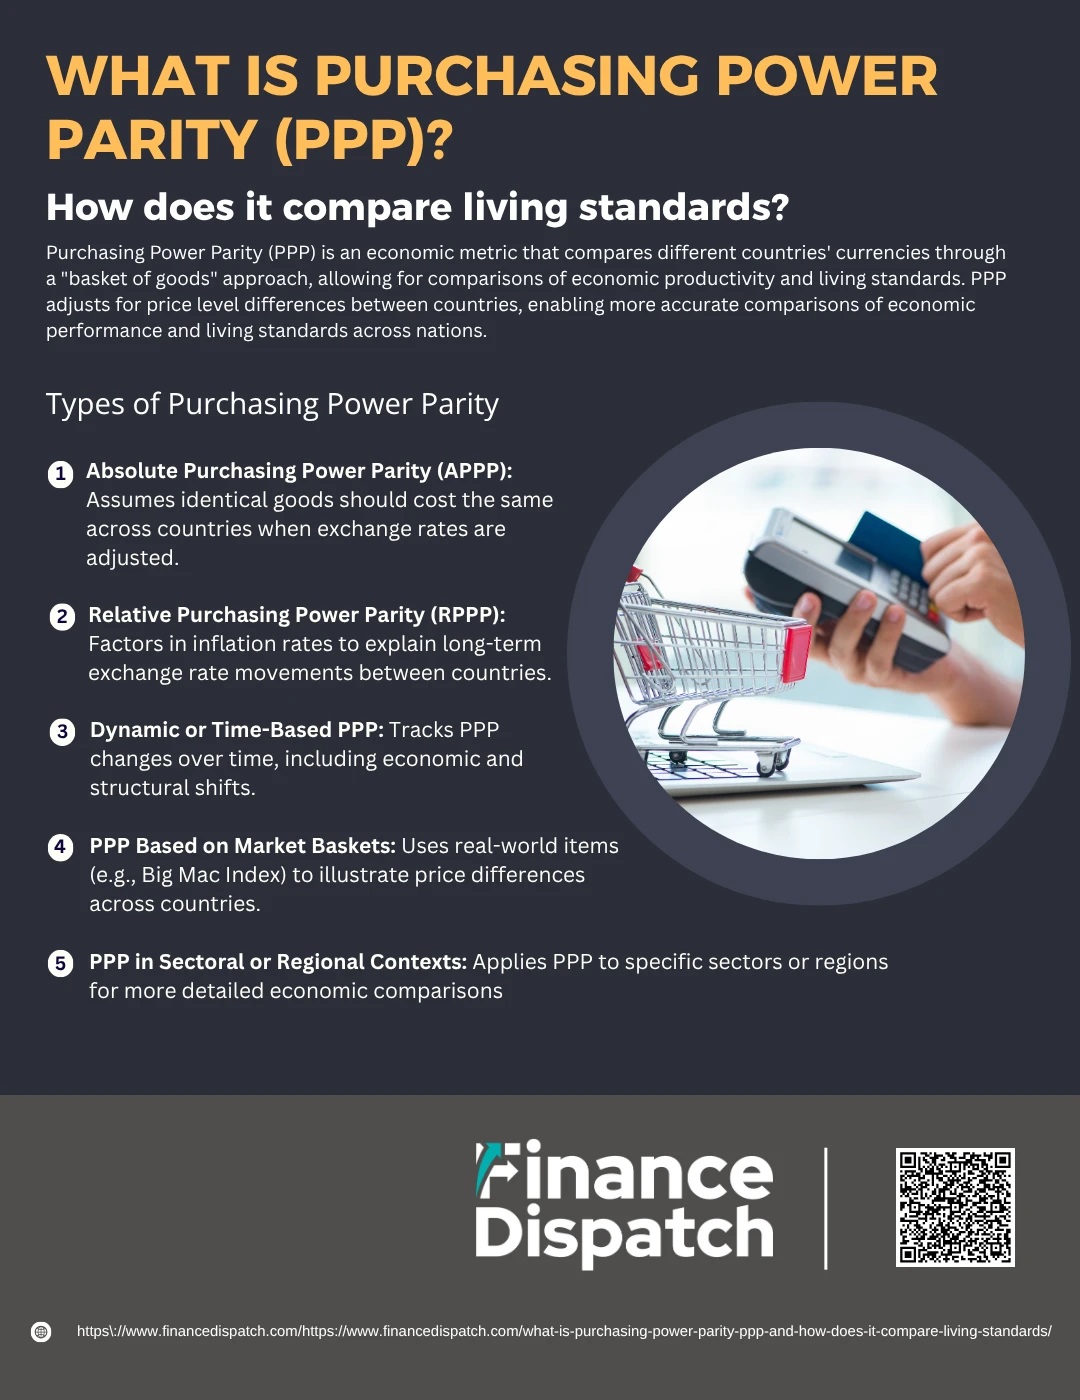
Purchasing Power Parity (PPP) is an economic concept that compares the relative value of currencies by examining the cost of a standardized basket of goods and services in different countries. The idea is that in the absence of transportation costs and trade barriers, identical goods should cost the same in any country when prices are expressed in a common currency. For example, if a soft drink costs $1.50 in the U.S. and the equivalent of $1.00 in another country, PPP suggests that the foreign currency is undervalued relative to the U.S. dollar. By adjusting for local price levels, PPP allows economists and policymakers to better compare real income, consumption, and economic well-being across nations, making it a more accurate tool than nominal exchange rates for international comparisons.
 Types of Purchasing Power Parity
Purchasing Power Parity (PPP) can be categorized into different types based on how it accounts for factors like inflation and time. Understanding these types is essential for accurately comparing currencies and economic conditions across countries. The two most widely recognized forms of PPP are Absolute PPP and Relative PPP. Each provides a different perspective on how exchange rates relate to price levels between nations.
1. Absolute Purchasing Power Parity (APPP)
This type of PPP assumes that once currency exchange is accounted for, the same basket of goods should cost the same in every country. It’s a direct price-level comparison that does not consider inflation or time-based changes. While simple in theory, it doesn’t account for transportation costs, taxes, or market differences.
2. Relative Purchasing Power Parity (RPPP)
Relative PPP builds on the absolute version by factoring in inflation rates. It suggests that if one country experiences higher inflation than another, its currency should depreciate accordingly to maintain purchasing power balance over time. This approach provides a more dynamic and realistic view of currency value changes.
3. Dynamic or Time-Based PPP
This type tracks how PPP evolves over a period, incorporating inflation trends, economic growth, and structural changes in pricing. It’s useful for long-term policy analysis and forecasting.
4. PPP Based on Market Baskets
Some PPP calculations use specific baskets of goods, such as the Big Mac Index or KFC Index, to illustrate real-world examples of price differences. These indexes highlight how local costs and consumption habits affect purchasing power in everyday life.
5. PPP in Sectoral or Regional Contexts
PPP can also be applied to specific sectors or regions within countries. For example, comparing urban vs. rural cost of living or healthcare costs across countries helps refine economic comparisons in targeted areas.
 How Is PPP Calculated?
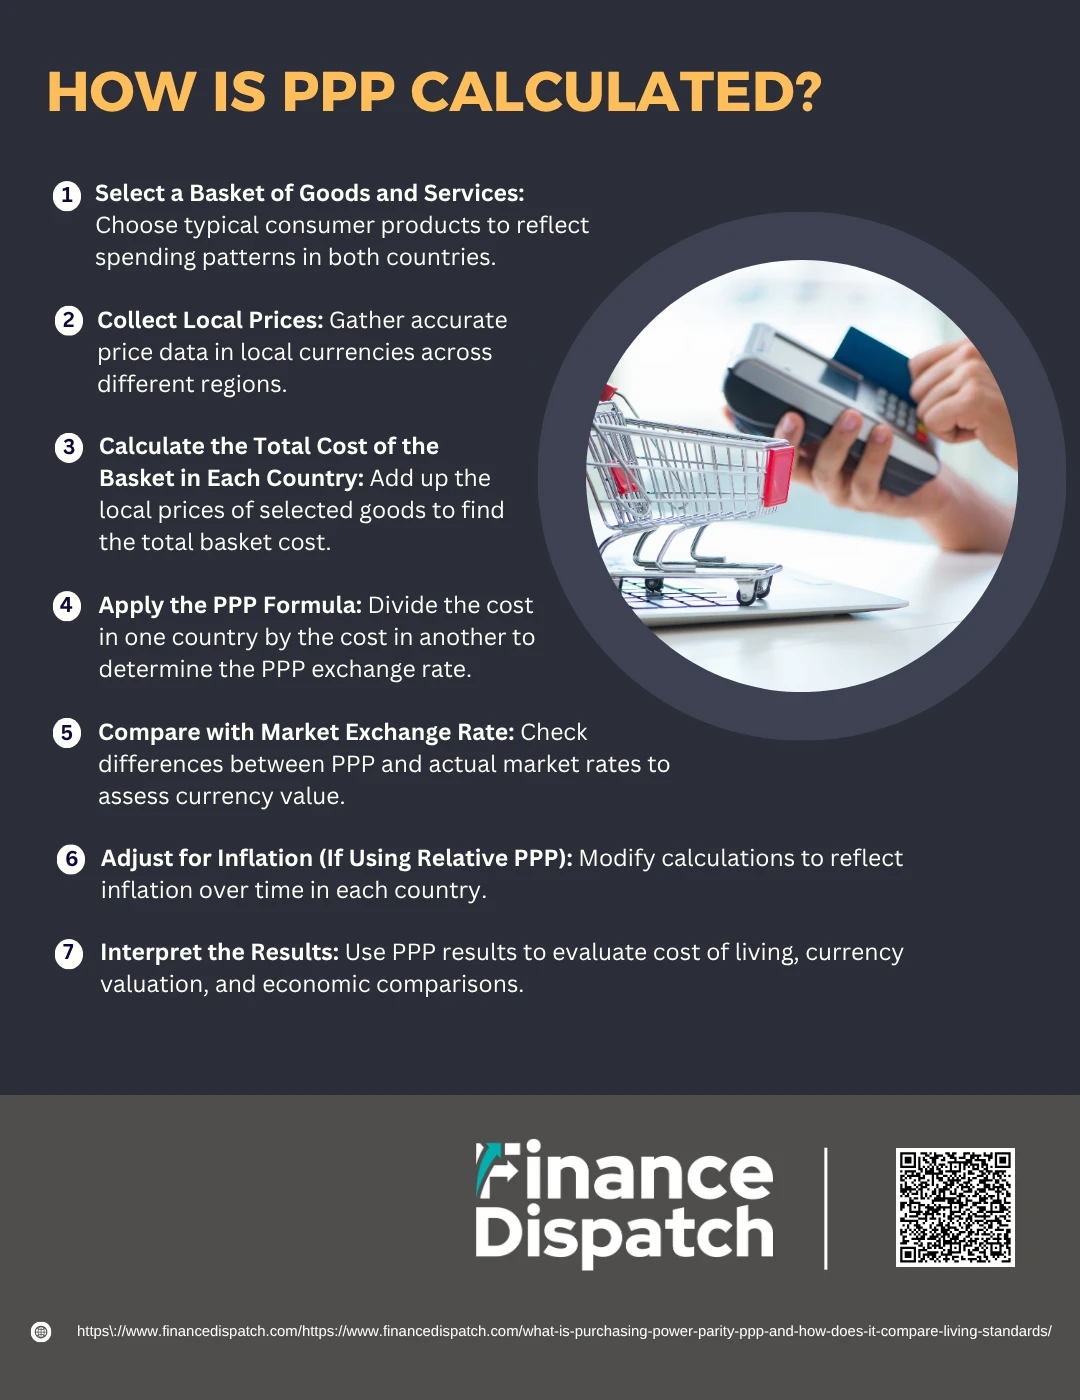
Purchasing Power Parity (PPP) is calculated by comparing the cost of a fixed basket of goods and services in two different countries. The purpose is to determine the exchange rate at which consumers in both countries would be able to purchase the same quantity and quality of goods. This method helps eliminate the distortion caused by fluctuating market exchange rates and provides a more accurate reflection of a currency’s true value in terms of everyday consumption. PPP calculations can be simple in theory but require careful selection of products and accurate pricing data. Here’s a step-by-step breakdown of how PPP is calculated:
1. Select a Basket of Goods and Services
Choose a consistent and representative set of products and services—such as food, clothing, transportation, housing, and healthcare—that reflect typical consumer spending in both countries.
2. Collect Local Prices
Gather current price data for each item in the basket using local currencies. Prices should be collected from a variety of regions and sources to account for market variation and ensure reliability.
3. Calculate the Total Cost of the Basket in Each Country
Add up the prices of all the selected goods and services in each country. This gives the total cost of the basket in local currency, which is essential for the comparison.
4. Apply the PPP Formula
Use the formula:
PPP Exchange Rate = Cost of Basket in Country A / Cost of Basket in Country B
This yields the exchange rate that equalizes purchasing power between the two countries.
5. Compare with Market Exchange Rate
Evaluate the difference between the PPP rate and the current market exchange rate. A large discrepancy can indicate whether a currency is undervalued or overvalued relative to its actual purchasing power.
6. Adjust for Inflation (If Using Relative PPP)
For relative PPP, account for inflation by adjusting the basket’s cost over time. This shows how changes in price levels influence exchange rate movements and purchasing power over the long term.
7. Interpret the Results
Use the calculated PPP to assess cost-of-living differences, determine currency valuation, and make international economic comparisons more meaningful. It can guide investment decisions, policy analysis, and GDP adjustments.
PPP vs. Nominal Exchange Rates
When comparing economic performance or living standards between countries, it’s important to understand the difference between Purchasing Power Parity (PPP) and nominal exchange rates. While nominal exchange rates reflect the price at which currencies are traded on the global market, PPP takes into account the local cost of goods and services. This makes PPP a more stable and accurate indicator for long-term comparisons, especially when evaluating the real value of income and economic output. The table below outlines the key differences between the two:
| Feature | Purchasing Power Parity (PPP) | Nominal Exchange Rate |
| Definition | Theoretical exchange rate based on equal cost of goods | Market-based rate for exchanging currencies |
| Focus | Real purchasing power of currencies | Currency value determined by forex supply and demand |
| Stability | More stable over time | Highly volatile, subject to speculation and market forces |
| Usage | Comparing GDP, living standards, and cost of living | Used in currency trading, tourism, and real-time payments |
| Includes | Domestic price levels and inflation | Only traded goods and capital flow influences |
| Affected by | Inflation, cost of living, non-tradable goods | Interest rates, political events, market sentiment |
| Best For | Long-term economic analysis and cross-country comparisons | Short-term financial transactions and trading |
 Comparing Living Standards Using PPP
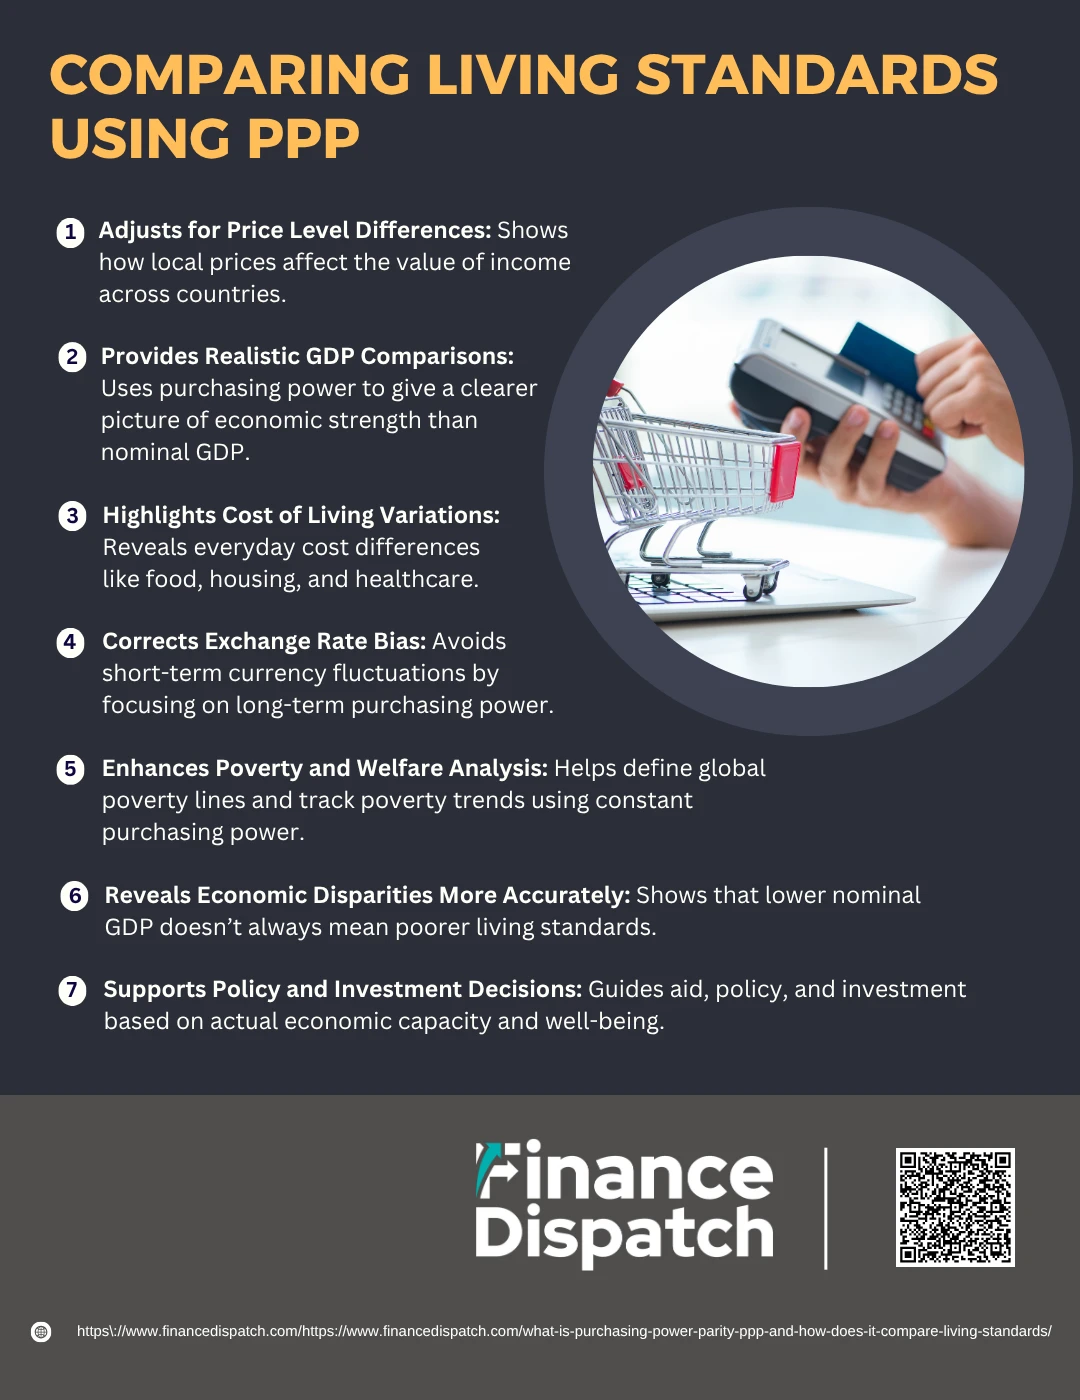
When evaluating how well people live across different countries, comparing incomes alone doesn’t tell the full story. That’s because a dollar doesn’t buy the same amount of goods everywhere. Purchasing Power Parity (PPP) solves this problem by adjusting for differences in the cost of living. It shows what people can actually buy with their income in their home country, providing a clearer measure of real living conditions. By using PPP instead of market exchange rates, economists and policymakers can make more accurate comparisons of economic well-being, social progress, and the effectiveness of government policies. Here’s how PPP plays a vital role in comparing living standards:
1. Adjusts for Price Level Differences
PPP considers local price levels, ensuring comparisons account for the fact that goods and services may be cheaper in one country than another. For instance, $1 may buy a full meal in India but only a cup of coffee in the U.S.
2. Provides Realistic GDP Comparisons
Rather than converting GDP using volatile exchange rates, PPP adjusts GDP figures based on what people can actually buy. This gives a better picture of national economic strength and individual well-being.
3. Highlights Cost of Living Variations
PPP makes it possible to compare how much everyday expenses—such as housing, food, transportation, and healthcare—differ from country to country, which is crucial for comparing real living conditions.
4. Corrects Exchange Rate Bias
Market exchange rates often fluctuate due to speculation or political instability. PPP ignores these short-term swings and focuses on long-term purchasing power, offering a steadier basis for comparison.
5. Enhances Poverty and Welfare Analysis
Global institutions use PPP to define the international poverty line (e.g., $1.90/day). This helps track how many people live in extreme poverty worldwide, regardless of currency changes.
6. Reveals Economic Disparities More Accurately
A country may appear poor based on nominal GDP, but when adjusted using PPP, it may rank much higher because its residents can afford more with their incomes.
7. Supports Policy and Investment Decisions
Governments, NGOs, and investors use PPP data to design aid programs, assess economic potential, and determine whether citizens are truly benefiting from growth. It’s also valuable for comparing minimum wages and household income across borders.
Everyday Examples of PPP in Action
While Purchasing Power Parity (PPP) is often discussed in academic and economic contexts, it also plays a visible role in everyday life. PPP influences the prices we pay for goods, the cost of living in different countries, and even how we evaluate international affordability when traveling, working abroad, or comparing salaries. These real-world examples help illustrate how PPP affects consumers beyond charts and GDP reports.
1. Coffee Prices Around the World
A basic cup of coffee may cost $0.78 in Italy but over $4.00 in the UAE. Though the ingredients are nearly the same, the final price reflects local purchasing power and market conditions.
2. Housing Costs
The price of a 70 square metre flat in central London might be £917,000, while a similar-sized flat in central Cape Town could cost just £140,000. PPP helps explain such massive differences in affordability.
3. Big Mac Index
Created by The Economist, this informal PPP index compares the price of a McDonald’s Big Mac in various countries. It shows whether currencies are over- or undervalued based on a standard fast-food item.
4. KFC Index in Africa
Since McDonald’s isn’t widely available in Africa, researchers created the KFC Index, using the price of a 15-piece bucket to measure purchasing power across African currencies.
5. Public Transportation Costs
A train ride in New York City may cost $2.90, while in Mumbai it might cost only $0.25. PPP helps us understand how transportation affordability varies across locations.
6. Haircuts and Personal Services
Non-tradable services like haircuts show significant PPP differences. A haircut in Paris could cost €30, whereas the same service in Manila may cost only a few dollars, despite being nearly identical in quality.
7. Imported Consumer Electronics
Goods like smartphones may carry similar price tags globally, but their affordability varies. A $1,000 phone is a luxury in some countries and a mid-range product in others, depending on PPP.
PPP and Global Economic Applications
Purchasing Power Parity (PPP) plays a critical role in global economic analysis, offering a more accurate basis for comparing productivity, income levels, and overall economic well-being across nations. Institutions like the World Bank, International Monetary Fund (IMF), and OECD rely on PPP-adjusted data to make policy decisions, allocate development aid, and assess economic progress. Unlike nominal figures that are skewed by exchange rate fluctuations, PPP-adjusted metrics provide a stable and realistic comparison of countries’ real output and consumption levels. PPP is also used to measure poverty rates, estimate carbon emissions relative to economic activity, and evaluate whether currencies are undervalued or overvalued. These applications make PPP a vital tool in understanding global disparities, designing effective policies, and forecasting long-term economic trends.
PPP in Financial Markets
In financial markets, Purchasing Power Parity (PPP) serves as a valuable tool for assessing the long-term value of currencies and guiding investment decisions. Traders and analysts use PPP to identify whether a currency is overvalued or undervalued relative to another, based on the cost of goods and services in each country. This information can inform strategies in the foreign exchange (forex) market, where investors might take long or short positions depending on whether they expect a currency to move toward its PPP-implied value. While PPP is not typically used for short-term trading due to its inability to account for market volatility, geopolitical events, or capital flows, it remains an essential part of fundamental analysis. Additionally, PPP can influence decisions in international stock and bond markets, especially when evaluating the impact of exchange rates on foreign investments.
Key Indices That Use PPP
To make the concept of Purchasing Power Parity (PPP) more tangible and accessible, economists and researchers have developed various indices that apply PPP principles to real-world examples. These indices compare the cost of a specific item or basket of goods across countries to highlight differences in currency valuation and local purchasing power. Some are created for professional economic analysis, while others serve as simple, illustrative tools to help people understand how far their money goes in different parts of the world.
1. OECD Comparative Price Index
Developed by the Organisation for Economic Co-operation and Development (OECD), this index measures the relative cost of a standardized basket of goods across member countries to assess currency value and cost of living.
2. Big Mac Index
Introduced by The Economist, this popular and playful index compares the price of a McDonald’s Big Mac in various countries. It provides a quick snapshot of currency under- or overvaluation using a globally standardized product.
3. KFC Index
Created by Sagaci Research, the KFC Index is modeled after the Big Mac Index but focuses on African countries, where KFC is more prevalent. It uses the price of a 15-piece chicken bucket to compare purchasing power.
4. iPad Index
This index uses the price of an Apple iPad across different countries to reveal discrepancies in local currency valuations and global pricing strategies for tech products.
5. Starbucks Tall Latte Index
By comparing the cost of a Starbucks tall latte worldwide, this index helps illustrate global price variations in the service sector and offers a modern twist on consumer purchasing power.
Limitations of PPP
While Purchasing Power Parity (PPP) is a useful tool for comparing currencies and living standards across countries, it has several limitations that affect its accuracy and applicability. The theory is based on assumptions that often don’t hold true in the real world, such as identical goods, free trade, and equal access to markets. As a result, PPP can sometimes provide an oversimplified or misleading view of economic conditions. Understanding its shortcomings is crucial for interpreting PPP data with the right context and caution.
1. Trade Barriers and Tariffs
Import duties, quotas, and trade restrictions can cause significant price differences between countries, making the same goods cost more in some regions regardless of currency value.
2. Transportation and Transaction Costs
PPP assumes costless trade, but in reality, transporting goods between countries incurs shipping, handling, and distribution costs that distort price parity.
3. Non-Tradable Goods and Services
Items like haircuts, rent, or local services are not traded internationally, and their prices vary widely, reducing the accuracy of PPP in reflecting real-world living costs.
4. Differences in Product Quality
Goods compared under PPP may not be identical in quality or features, even if they are labeled the same, which can skew comparisons between countries.
5. Data Collection Challenges
Gathering reliable and consistent price data across countries is difficult. Discrepancies in data sources and survey methods can affect the accuracy of PPP calculations.
6. Changing Consumer Preferences
Baskets of goods used in PPP comparisons may not reflect the same consumption patterns across cultures, making it hard to define a universally representative bundle.
7. Short-Term Market Dynamics Ignored
PPP does not account for short-term factors like interest rates, speculation, or political events that influence actual exchange rates, limiting its use in real-time financial decisions.
Conclusion
Purchasing Power Parity (PPP) offers a powerful lens through which to compare currencies, economic productivity, and living standards across countries. By adjusting for differences in local price levels, PPP provides a more realistic measure of what people can actually afford in their home economies, beyond what nominal exchange rates suggest. While it has its limitations—such as trade barriers, data challenges, and the difficulty of comparing non-tradable goods—PPP remains a crucial tool for economists, policymakers, and investors. From guiding international policy to evaluating global poverty and currency valuation, PPP helps bridge the gap between monetary figures and real-world economic conditions, making cross-country comparisons more meaningful and insightful.


