
Technical analysis is a popular method used by traders and investors to forecast future price movements in financial markets by studying historical data, primarily price and volume. Unlike fundamental analysis, which evaluates a security’s intrinsic value based on financial statements and economic indicators, technical analysis focuses solely on market behavior and trends. By analyzing charts, patterns, and statistical indicators, technical analysts aim to identify trading opportunities and make informed decisions. This approach assumes that all available information is already reflected in the price, and that price movements follow identifiable trends that tend to repeat over time.
What Is Technical Analysis?
Technical analysis is the study of past market data—primarily price and volume—to forecast future price movements of financial assets. It is based on the idea that all relevant information, including economic factors and investor sentiment, is already reflected in a security’s market price. Instead of examining a company’s financial health or broader economic indicators, technical analysts focus on identifying patterns and trends within price charts. These patterns are believed to recur over time due to consistent investor behavior driven by emotions like fear and greed. Through tools such as moving averages, trend lines, and oscillators, technical analysis helps traders determine the most likely direction of a market and the best times to enter or exit trades.
Core Principles of Technical Analysis
At the heart of technical analysis lie a few foundational beliefs that guide how analysts interpret market data. These principles are rooted in the idea that market behavior follows certain patterns and that these patterns can be analyzed to make informed trading decisions. Understanding these core concepts is essential for anyone looking to use technical analysis effectively.
1. The Market Discounts Everything: Technical analysis assumes that all existing information—economic, political, psychological—is already factored into the current price of an asset. Therefore, price is the most important data point to analyze.
2. Prices Move in Trends: One of the most fundamental principles is that asset prices tend to move in identifiable trends—upward, downward, or sideways—rather than randomly. Traders aim to ride these trends for maximum gains.
3. History Tends to Repeat Itself: Market patterns often recur over time due to the consistent behavior of market participants. Technical analysts use past price patterns and chart formations to predict future movements, believing that human psychology drives similar outcomes in similar situations.
 How Technical Analysis Works
Technical analysis operates on the belief that price movements are not random but follow trends and patterns shaped by market psychology. By studying historical data—primarily price and volume—traders seek to uncover signals that can forecast future market direction. The process involves a structured analysis of charts, statistical indicators, and price behavior to identify profitable trading opportunities. Rather than focusing on what an asset should be worth (as in fundamental analysis), technical analysts focus on how the market behaves in order to make decisions.
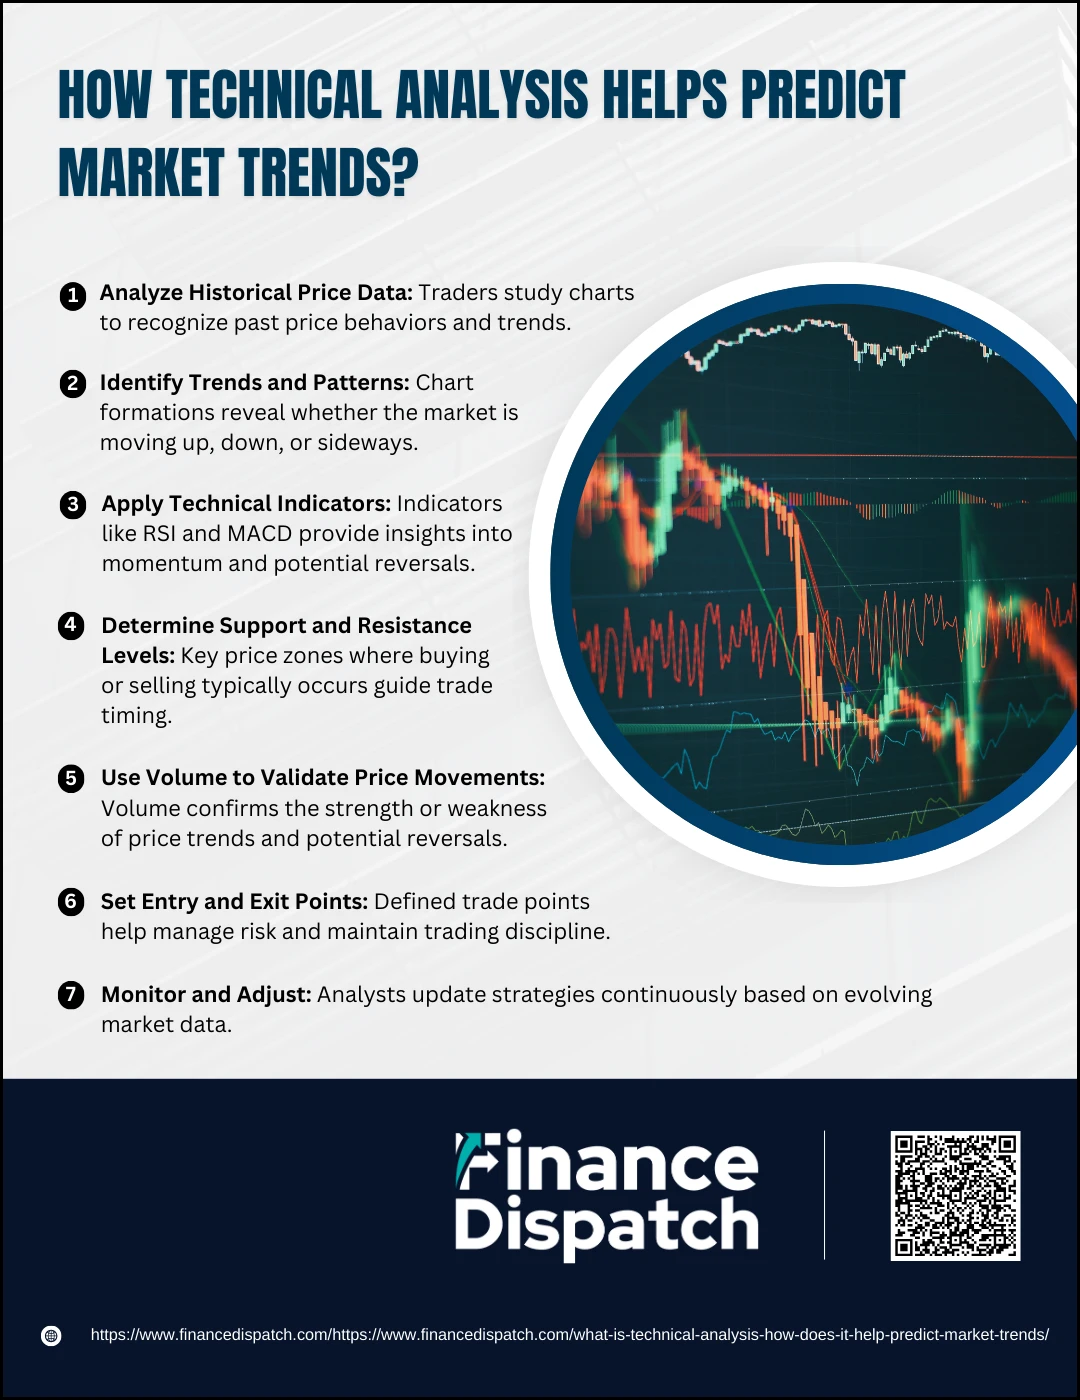
1. Analyze Historical Price Data
Technical analysts begin by examining past price movements using various types of charts such as line, bar, or candlestick charts. These charts provide a visual representation of how an asset has behaved over time and help identify repeating patterns and long-term trends.
2. Identify Trends and Patterns
Recognizing whether a market is in an uptrend, downtrend, or sideways trend is essential. Analysts look for specific chart formations like head and shoulders, double tops and bottoms, flags, and wedges, which can signal upcoming market moves.
3. Apply Technical Indicators
Indicators are mathematical formulas applied to price and volume data to provide deeper insight. Common tools include Moving Averages (to identify trend direction), RSI (to assess momentum), MACD (to signal changes in momentum), and Bollinger Bands (to measure volatility).
4. Determine Support and Resistance Levels
These are price points where assets have historically reversed direction. Support indicates a price level where buyers tend to enter the market, while resistance marks a level where sellers emerge. These zones are critical for timing trades and setting stop-loss or profit targets.
5. Use Volume to Validate Price Movements
Volume reveals the strength of a price move. A rising market on high volume typically signals strong buyer interest, while a rising market on low volume may indicate a weak or unsustainable trend. Volume also helps detect potential reversals.
6. Set Entry and Exit Points
After confirming trends and patterns with indicators and volume, traders define their entry (buy or sell) and exit (profit-taking or stop-loss) points. These are critical for maintaining discipline and managing risk effectively.
7. Monitor and Adjust
Market conditions change frequently, so technical analysts continually update their analysis. As new data comes in, they may modify their strategies to adapt to emerging trends or unexpected reversals. This ongoing process helps maintain a dynamic and responsive trading plan.
Key Tools and Indicators in Technical Analysis
Technical analysis relies on a variety of tools and indicators to help traders interpret market behavior and make informed decisions. These tools provide insights into trends, momentum, volatility, and potential reversal points. By combining multiple indicators, analysts can confirm signals, reduce false positives, and enhance their trading strategies. Below is a table highlighting some of the most commonly used tools and their purposes in technical analysis.
| Tool/Indicator | Purpose |
| Moving Averages | Smooth out price data to identify trend direction and support/resistance levels. |
| Relative Strength Index (RSI) | Measures momentum and identifies overbought or oversold conditions. |
| MACD (Moving Average Convergence Divergence) | Tracks momentum and signals trend changes using moving average crossovers. |
| Bollinger Bands | Indicates market volatility and potential price breakouts. |
| Candlestick Patterns | Visual representations of price action that signal reversals or continuations. |
| Trendlines | Help define the direction and strength of a trend by connecting price points. |
| Support and Resistance | Identify key price levels where reversals or breakouts may occur. |
| Volume Indicators | Confirm the strength of a trend based on trading activity. |
| Fibonacci Retracement | Highlights potential reversal levels using ratios derived from the Fibonacci sequence. |
| Stochastic Oscillator | Compares closing price to price range over time to predict trend reversal points. |
Types of Market Trends
Understanding market trends is essential for making effective trading and investment decisions. A trend refers to the general direction in which an asset’s price is moving over a specific period. Identifying the type of trend helps traders align their strategies accordingly—whether to buy, sell, or hold. Market trends can be classified into three primary types based on the direction of price movement.
1. Uptrend (Bullish Trend)
An uptrend is characterized by a series of higher highs and higher lows, indicating increasing demand and investor optimism. This trend suggests that buyers are in control, and prices are likely to continue rising. Traders typically look for buying opportunities during pullbacks in an uptrend.
2. Downtrend (Bearish Trend)
A downtrend occurs when prices consistently form lower highs and lower lows. It signals prevailing selling pressure and negative market sentiment. In this scenario, traders often focus on short-selling opportunities or wait for signs of trend reversal before entering the market.
3. Sideways Trend (Ranging or Neutral Trend)
In a sideways trend, the price moves within a horizontal range without a clear upward or downward direction. This reflects a balance between buyers and sellers. Traders may look for breakout or breakdown opportunities when the price eventually moves out of the range.
How Technical Analysis Helps Predict Market Trends
Technical analysis offers traders and investors a structured way to evaluate price movements and anticipate where the market might head next. Unlike fundamental analysis, which looks at financial statements and economic data, technical analysis focuses on price action, volume, and chart patterns. It operates on the belief that market trends are not random and that historical behavior tends to repeat itself due to consistent investor reactions. Here’s a more detailed look at how technical analysis helps in predicting market trends:
1. Identifies the Direction of the Trend
Technical analysis helps determine whether a market is in an uptrend, downtrend, or moving sideways. By using trendlines and moving averages, traders can confirm the direction and align their positions with the prevailing market movement, rather than going against it.
2. Highlights Entry and Exit Points
Timing is everything in trading. Technical tools such as support and resistance levels, Fibonacci retracements, and candlestick patterns help traders spot strategic entry points during pullbacks and optimal exit points when a trend shows signs of exhaustion or reversal.
3. Measures Market Momentum
Momentum indicators like the Relative Strength Index (RSI), MACD, and Stochastic Oscillator allow analysts to gauge how strong a trend is. They help determine whether a market is overbought or oversold, indicating whether a price move has room to continue or is due for a correction.
4. Confirms Trend Strength with Volume
Volume analysis is essential for verifying the legitimacy of price movements. A breakout or trend accompanied by high volume is more likely to sustain than one with weak volume, which could indicate a lack of commitment from traders and the possibility of a false move.
5. Detects Potential Reversals Early
Technical patterns like double tops/bottoms, head and shoulders, and wedge formations often act as early warnings of trend reversals. When combined with indicators showing divergence—such as falling momentum while price is rising—these signs can help traders prepare for potential changes in direction.
6. Reduces Emotional Decision-Making
One of the key benefits of technical analysis is its ability to provide objective, rules-based signals. This reduces the influence of fear, greed, and other emotions, helping traders stay disciplined and consistent in their approach.
7. Adapts to Different Timeframes
Whether you’re a day trader, swing trader, or long-term investor, technical analysis can be tailored to fit your strategy. It works on all timeframes—from 5-minute charts to monthly ones—making it a versatile tool for a wide range of trading styles and goals.
Technical vs. Fundamental Analysis
When analyzing financial markets, traders often rely on either technical analysis or fundamental analysis—or a combination of both. These two approaches offer distinct methods of evaluating securities. Technical analysis focuses on historical price action and market behavior, while fundamental analysis centers on a company’s financial health and economic outlook. Understanding the differences between these methods can help traders choose the right approach based on their goals, trading style, and investment horizon.
| Aspect | Technical Analysis | Fundamental Analysis |
| Primary Focus | Price and volume data | Financial statements and economic indicators |
| Objective | Identify short-term trends and trading signals | Determine intrinsic value of an asset |
| Data Used | Charts, patterns, technical indicators (e.g., RSI, MACD, Moving Averages) | Earnings, revenue, debt, macroeconomic data, industry outlook |
| Timeframe | Short to medium-term trading | Medium to long-term investing |
| Market Assumption | All known information is reflected in price | Markets may not always price assets accurately |
| Tools and Techniques | Chart patterns, support/resistance, momentum indicators | Financial ratios, balance sheets, P/E ratios, interest rates |
| Best For | Timing entries and exits in volatile markets | Understanding long-term value and growth potential |
| Drawbacks | May ignore broader economic or fundamental factors | May miss short-term market trends and price action |
| Used By | Active traders, technical analysts | Long-term investors, fundamental analysts |
 Advantages of Technical Analysis
Technical analysis equips traders and investors with a structured method for interpreting market behavior and forecasting future price movements. Unlike fundamental analysis, which requires evaluating financial statements and economic data, technical analysis focuses purely on how the market behaves—through price, volume, and trends. This makes it especially attractive to those who prefer actionable, visual insights and data-driven strategies. Whether used on its own or in combination with other methods, technical analysis offers several clear advantages:
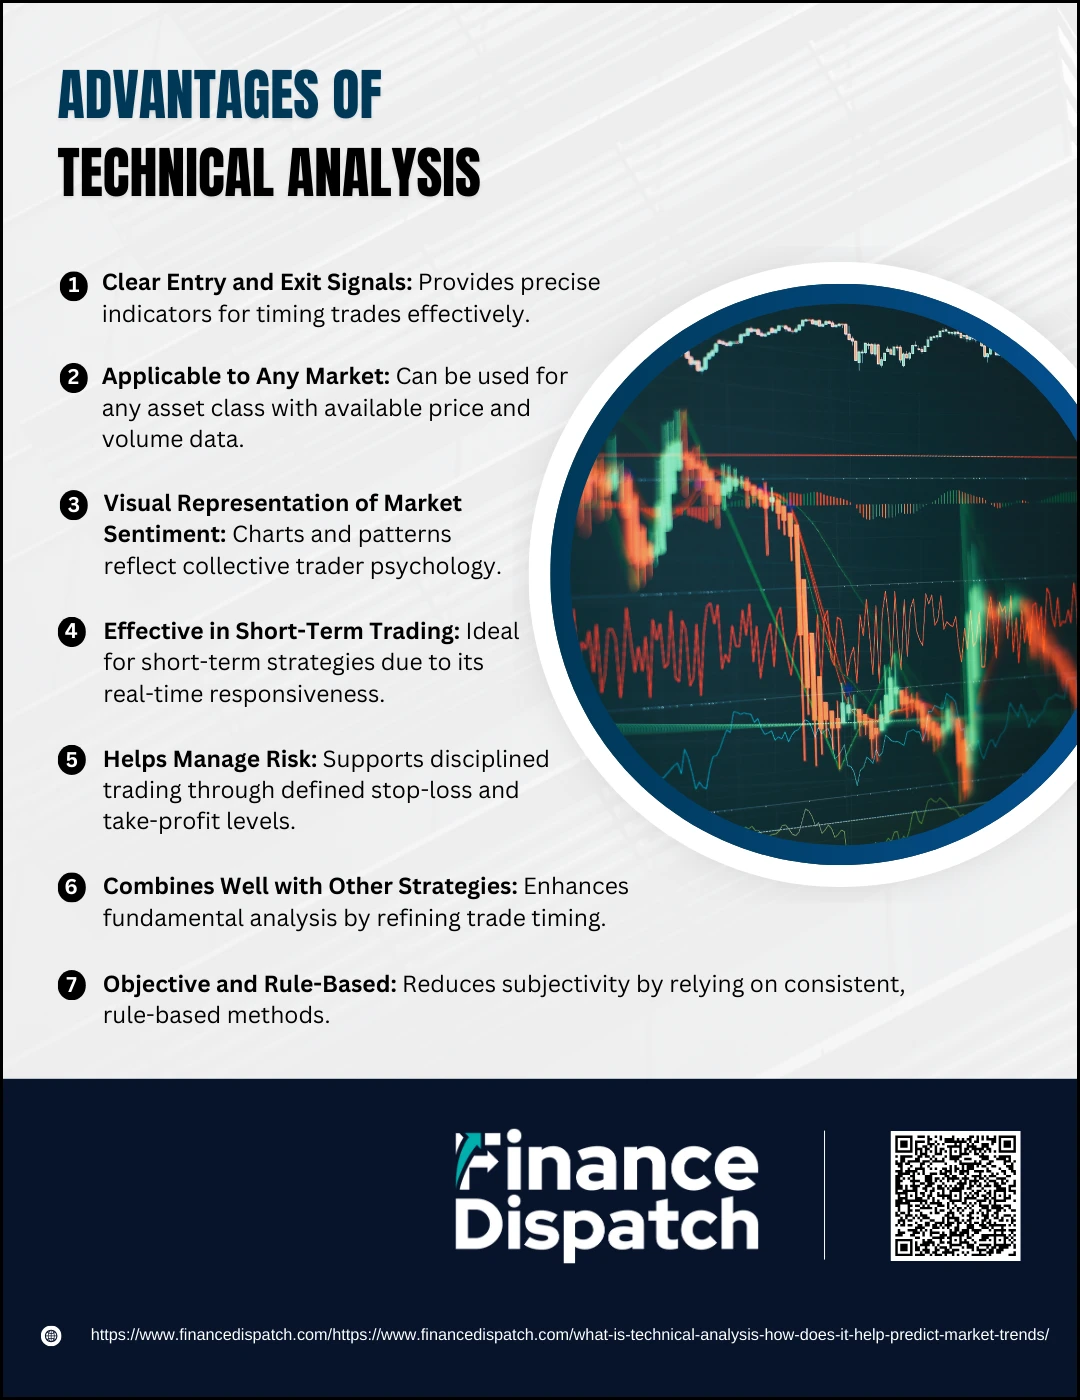
1. Clear Entry and Exit Signals
Technical analysis provides well-defined strategies for when to enter or exit a trade. Tools like moving averages, RSI, MACD, and candlestick patterns help traders identify potential reversal zones, breakouts, and pullbacks. This clarity helps reduce guesswork and enhances timing, which is especially crucial in fast-moving markets.
2. Applicable to Any Market
One of the biggest strengths of technical analysis is its flexibility. It can be applied to any tradable asset—stocks, forex, commodities, indices, or cryptocurrencies—as long as price and volume data are available. This makes it a universal tool across markets and geographies.
3. Visual Representation of Market Sentiment
Technical analysis translates complex market data into visual charts that reveal investor psychology. Trends, chart patterns, and volume shifts expose whether buyers or sellers dominate, allowing traders to anticipate future movements based on collective market behavior.
4. Effective in Short-Term Trading
While it can be used for long-term investing, technical analysis is particularly powerful for short-term traders like scalpers and swing traders. It enables them to capitalize on small price movements using real-time data, often with minimal reliance on broader market news or fundamentals.
5. Helps Manage Risk
Technical analysis promotes disciplined risk management. Traders can set stop-loss and take-profit orders based on chart levels and indicator signals, helping them protect their capital and limit losses. This approach ensures that risk is predefined and controlled before entering a trade.
6. Combines Well with Other Strategies
Although often used on its own, technical analysis complements fundamental analysis. Traders may use fundamentals to identify what to trade and technicals to decide when to trade. This dual approach balances long-term value with short-term timing.
7. Objective and Rule-Based
Technical analysis follows a systematic approach. Strategies are often built on clearly defined rules, which helps eliminate emotional decision-making. By relying on data and consistent patterns, traders are less likely to make impulsive decisions based on fear, greed, or external noise.
 Limitations of Technical Analysis
Although technical analysis is a widely used and valuable tool for analyzing market trends and making trading decisions, it’s important to recognize that it has inherent limitations. It primarily focuses on historical price and volume data, which can overlook the broader context, such as economic events or company fundamentals. Moreover, the effectiveness of technical analysis depends heavily on the trader’s skill, discipline, and ability to interpret patterns correctly. Understanding its limitations can help traders avoid blind spots and use technical analysis more strategically, often in combination with other methods.
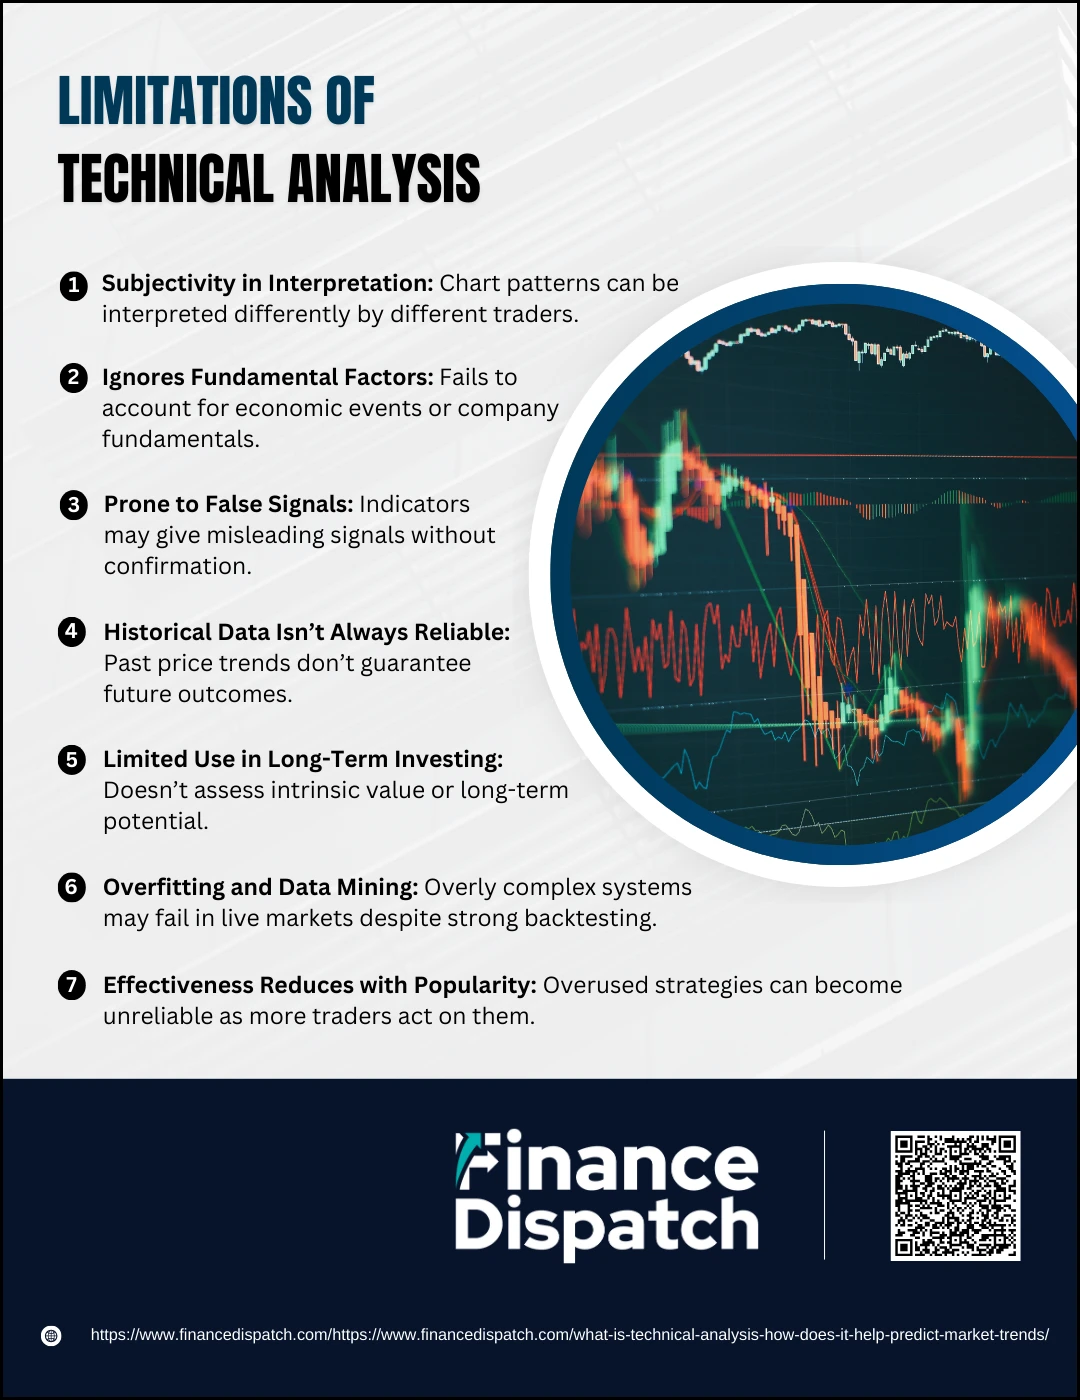
1. Subjectivity in Interpretation
One of the biggest challenges in technical analysis is that many patterns and signals are open to interpretation. For example, two traders may view the same chart and reach completely different conclusions—one seeing a breakout, the other a false signal. This subjectivity can lead to inconsistent decision-making and conflicting trading strategies.
2. Ignores Fundamental Factors
Technical analysis does not take into account a company’s financial health, economic indicators, or news events. A chart may show a bullish pattern, but unexpected earnings reports, regulatory changes, or geopolitical developments can quickly reverse the trend—factors that are only captured through fundamental analysis.
3. Prone to False Signals
Indicators such as RSI, MACD, or moving averages can sometimes produce signals that look promising but fail to materialize. For instance, a breakout might reverse quickly, trapping traders in losing positions. Relying on a single indicator without additional confirmation increases the risk of acting on noise rather than meaningful signals.
4. Historical Data Isn’t Always Reliable
Technical analysis is based on the assumption that “history repeats itself.” However, past performance doesn’t guarantee future results. Markets evolve due to new technologies, regulations, and behavior shifts. Patterns that worked well in the past may lose their effectiveness in a changing market environment.
5. Limited Use in Long-Term Investing
While technical analysis is highly effective for short- and medium-term strategies, it often falls short for long-term investors. It doesn’t provide insights into a company’s intrinsic value, competitive advantages, or long-term growth prospects—all of which are crucial for building wealth over time.
6. Overfitting and Data Mining
Some traders over-analyze charts or create overly complex systems that work well only on historical data. These systems may appear profitable in backtests but fail in live markets because they are over-optimized and not adaptable to real-time changes.
7. Effectiveness Reduces with Popularity
When too many traders follow the same technical signals, such as a popular moving average crossover or a known chart pattern, the market can become overly crowded. This can lead to short-lived movements or fake-outs as everyone acts on the same expectation, reducing the reliability of the signal.
Best Practices for Technical Analysts
To succeed with technical analysis, it’s essential to go beyond simply reading charts and indicators. Successful technical analysts follow disciplined strategies, continuously refine their skills, and stay adaptable to market conditions. Whether you’re a beginner or an experienced trader, applying best practices can improve your accuracy, reduce emotional bias, and help you make more informed decisions in any market environment.
1. Use Multiple Timeframes: Analyze charts across different timeframes (e.g., daily, weekly, and monthly) to confirm trends and avoid false signals. This top-down approach offers better clarity on the overall market direction.
2. Combine Indicators for Confirmation: Relying on one indicator can lead to misleading signals. Use a combination of trend, momentum, and volume indicators to validate trading decisions.
3. Practice Risk Management: Always set stop-loss and take-profit levels before entering a trade. Never risk more than a small percentage of your trading capital on a single trade to preserve long-term success.
4. Avoid Overtrading: Don’t trade just because a chart looks interesting. Wait for high-probability setups that align with your strategy, and avoid entering trades based on emotion or impatience.
5. Keep a Trading Journal: Maintain detailed records of each trade, including entry/exit points, indicators used, outcomes, and emotional state. Reviewing this journal helps identify strengths, weaknesses, and areas for improvement.
6. Backtest Your Strategies: Before using a new strategy in live markets, test it on historical data to evaluate its effectiveness. This helps refine your approach and builds confidence.
7. Stay Updated and Keep Learning: Markets evolve, and so should your knowledge. Regularly read books, attend webinars, and follow market news to keep your skills sharp and stay ahead of trends.
8. Be Patient and Disciplined: Stick to your trading plan and avoid making impulsive decisions. Discipline and consistency are key to long-term success in technical analysis.
Conclusion
Technical analysis is a powerful tool that helps traders and investors understand market behavior and anticipate future price movements through the study of historical data, chart patterns, and indicators. While it offers clear advantages such as precise entry and exit signals and broad market applicability, it also comes with limitations that require careful consideration. By applying best practices—such as combining indicators, managing risk, and maintaining discipline—technical analysts can enhance their decision-making and reduce emotional bias. Ultimately, technical analysis is most effective when used as part of a balanced strategy, often in combination with fundamental insights, to navigate the ever-changing dynamics of financial markets with greater confidence and clarity.