
When people say “the stock market is up” or “Wall Street is down,” they’re often referring to the S&P 500. But what exactly is the S&P 500, and why does it matter so much? The S&P 500 is more than just a number scrolling across your financial news screen — it’s one of the most trusted benchmarks for tracking the performance of the U.S. stock market. Representing about 500 of the largest publicly traded companies across all major sectors, the index offers a broad snapshot of the country’s corporate and economic health. In this article, we’ll break down what the S&P 500 really is and how it reflects the pulse of the American market.
What is the S&P 500?
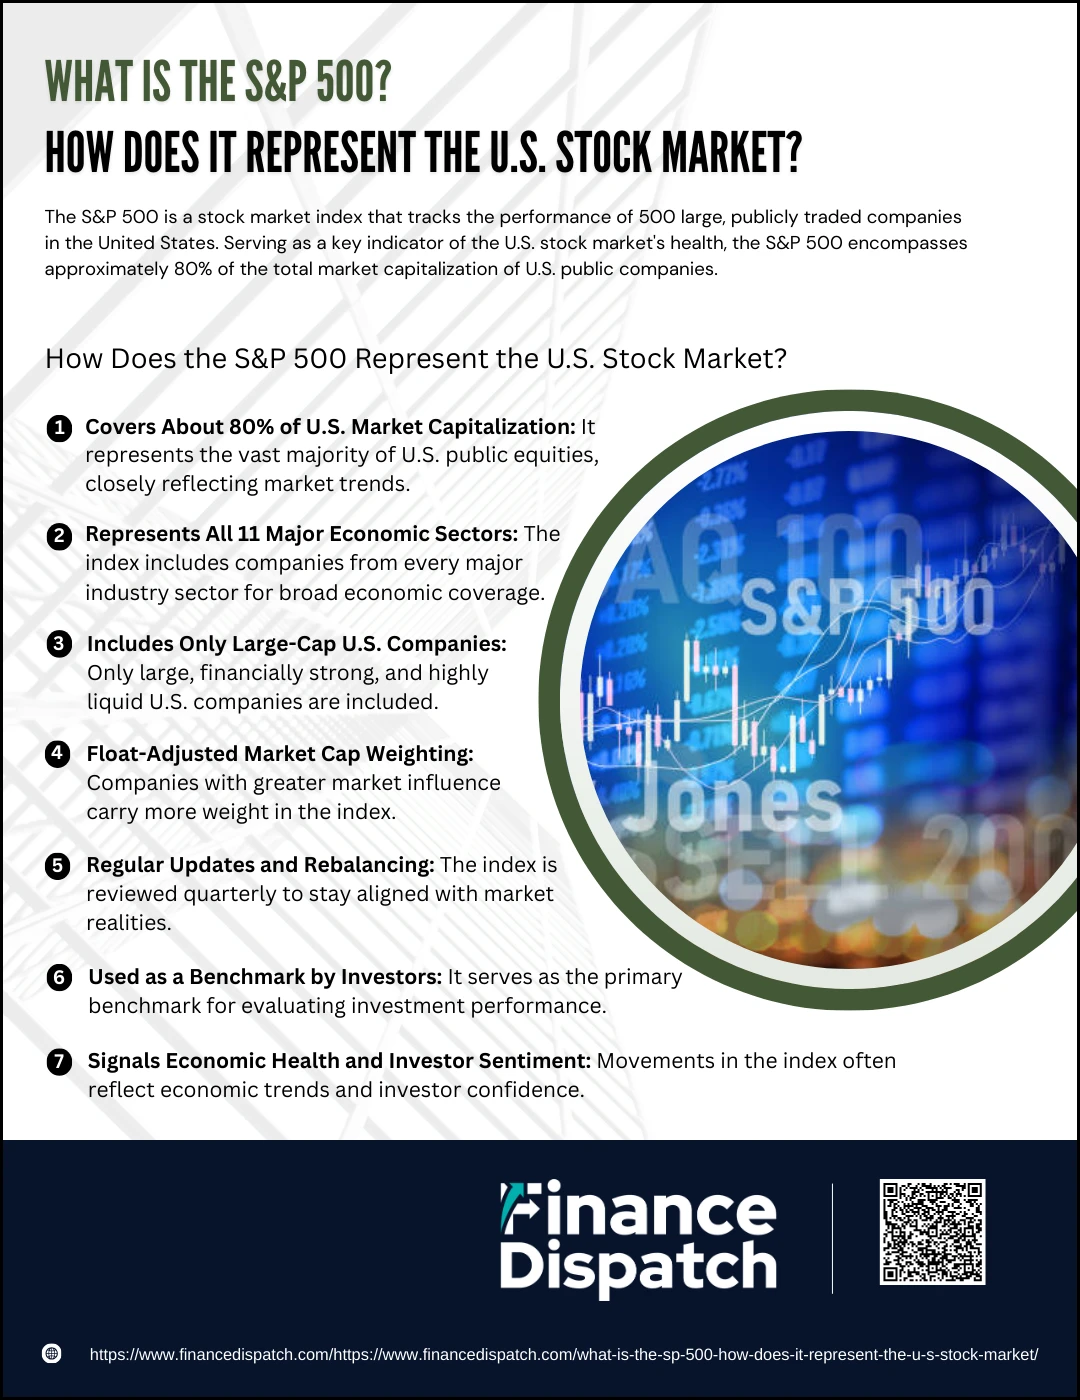
The S&P 500, short for the Standard & Poor’s 500 Index, is a stock market index that tracks the performance of approximately 500 of the largest publicly traded companies in the United States. These companies span a wide range of industries, including technology, healthcare, finance, energy, and consumer goods, making the index a comprehensive reflection of the U.S. economy. Unlike some other indexes that include only a handful of stocks, the S&P 500 covers about 80% of the total U.S. stock market capitalization. It’s a market-capitalization-weighted index, meaning that larger companies have a greater influence on its movement. Created in 1957, the S&P 500 has become a go-to benchmark for investors, analysts, and policymakers who want to gauge the overall health and direction of the U.S. equity market.
 How Does the S&P 500 Represent the U.S. Stock Market?
The S&P 500 is more than just a number—it’s a mirror of America’s corporate and economic strength. By tracking the performance of approximately 500 of the largest publicly traded U.S. companies, this index offers a powerful snapshot of how the stock market, and by extension, the U.S. economy, is doing. It reflects investor sentiment, market trends, and sector health, making it a go-to benchmark for analysts, fund managers, and everyday investors. Here’s a deeper look at how the S&P 500 truly represents the U.S. stock market:
1. Covers About 80% of U.S. Market Capitalization
The S&P 500 includes companies whose total market value accounts for approximately 80% of all publicly traded equities in the U.S. This means that its performance closely follows that of the overall market, making it a solid indicator of general market trends.
2. Represents All 11 Major Economic Sectors
The index includes companies from every sector classified under the Global Industry Classification Standard (GICS)—including information technology, healthcare, energy, financials, and consumer staples. This wide coverage ensures that the index reflects the diverse structure of the U.S. economy.
3. Includes Only Large-Cap U.S. Companies
Only companies with a large market capitalization—typically $14 billion or more—can qualify for the S&P 500. These are typically industry leaders with strong financial performance, high liquidity, and significant public interest, making them ideal representatives of corporate America.
4. Float-Adjusted Market Cap weighting
The index is not just about who is on the list but how much each company matters. Companies with more publicly traded shares and higher market value have more influence on the index’s movements. This weighting method ensures the index aligns with real-world investor exposure and market impact.
5. Regular Updates and Rebalancing
The S&P 500 is reviewed quarterly by a committee, and companies may be added or removed based on criteria like profitability, liquidity, and sector balance. This ensures the index stays current and accurately reflects the state of the U.S. market at any given time.
6. Used as a Benchmark by Investors
The index is the standard yardstick for evaluating investment performance. Many mutual funds and exchange-traded funds (ETFs) aim to replicate the S&P 500, and portfolio managers often compare their results to it, reinforcing its central role in the financial world.
7. Signals Economic Health and Investor Sentiment
Because it tracks major companies that are sensitive to economic cycles, the S&P 500 often serves as a leading indicator of economic health. Rising values suggest optimism and growth, while declines may point to economic slowdowns or market uncertainty.
Why the S&P 500 Matters
The S&P 500 matters because it serves as a trusted benchmark for measuring the performance of the U.S. stock market and, by extension, the health of the American economy. Its influence stretches beyond just market analysts—it’s widely used by fund managers, institutional investors, and even government policymakers to evaluate trends, forecast economic conditions, and guide financial decisions. The index includes a cross-section of major industries, offering a comprehensive view of corporate performance across sectors. Its broad coverage and transparent methodology make it an essential reference point for comparing investment performance, setting financial goals, and understanding market dynamics. Whether you’re an experienced investor or just getting started, the S&P 500 offers a clear, data-driven snapshot of how the market is moving and why it matters.
How is the S&P 500 Constructed?
The S&P 500 isn’t just a random collection of companies—it’s a carefully selected and systematically maintained index designed to reflect the structure of the U.S. large-cap stock market. A committee at S&P Dow Jones Indices oversees the selection process, ensuring that only companies meeting specific financial and operational criteria are included. The goal is to maintain a balanced, up-to-date snapshot of the most influential public companies in the country.
Here are the key elements involved in constructing the S&P 500:
1. U.S.-Based Companies Only: A company must be headquartered in the United States to qualify for inclusion in the index.
2. Minimum Market Capitalization: Companies must meet a minimum market cap threshold, which is periodically updated. As of 2025, it’s approximately $20.5 billion.
3. Public Float Requirement: At least 50% of a company’s shares must be available for public trading (known as the “free float”).
4. Positive Earnings History: The company must have reported positive earnings in the most recent quarter and over the sum of the past four quarters.
5. Listing on a Major U.S. Exchange: Companies must be listed on either the New York Stock Exchange (NYSE) or the Nasdaq.
6. Liquidity Standards: Stocks must demonstrate sufficient trading volume and activity to ensure they can be bought or sold easily.
7. Sector Balance Consideration: The committee aims to ensure sector diversity, so no one industry is overrepresented in the index.
8. Ongoing Reviews and Rebalancing: The index is reviewed quarterly, and companies may be added or removed based on evolving criteria and market conditions.
How the S&P 500 is calculated
The S&P 500 is a market-capitalization-weighted index, meaning that each company’s influence on the index is proportional to its market value. However, it goes a step further by using float-adjusted market capitalization, which considers only the shares available for public trading (excluding those held by insiders, institutions, or governments). To determine the index’s value, the total float-adjusted market cap of all 500 companies is summed up and then divided by a proprietary figure known as the divisor, which is adjusted over time to account for corporate actions like stock splits and dividends. This methodology ensures that the S&P 500 reflects true market movements without being distorted by non-economic factors.
Here’s a simplified breakdown of how it works:
| Component | Explanation |
| Market Cap of a Company | Stock Price × Number of Outstanding Shares |
| Float-Adjusted Market Cap | Market Cap × Percentage of Shares Available for Public Trading |
| Weight in Index | Float-Adjusted Market Cap ÷ Total Float-Adjusted Market Cap of All 500 Companies |
| Index Value Calculation | Sum of All Float-Adjusted Market Caps ÷ Index Divisor |
| Index Divisor | A proprietary number adjusted to maintain index continuity after structural changes |
What Does the S&P 500 Measures?
The S&P 500 is more than just a collection of stock prices—it’s a powerful tool that captures the overall performance, sentiment, and economic expectations of the U.S. stock market. By focusing on the largest and most actively traded companies across all major sectors, the index provides a well-rounded picture of how corporate America is performing. It’s often used by investors, economists, and financial analysts to gauge market trends, assess risk, and compare investment returns.
Here’s what the S&P 500 measures:
1. Market Capitalization: It reflects the combined market value of 500 of the largest publicly traded U.S. companies, adjusted for public float.
2. Stock Market Performance: The index tracks the rise and fall of large-cap stocks, offering a benchmark for the overall U.S. equity market.
3. Investor Sentiment: Changes in the S&P 500 often indicate how confident or cautious investors are feeling about the economy.
4. Sector Strength: Since it includes companies from all 11 economic sectors, the index can reveal which industries are performing well or struggling.
5. Economic Outlook: Because it’s forward-looking, the index incorporates expectations about future corporate earnings and economic growth.
6. Benchmark for Investments: The S&P 500 serves as the standard for comparing the performance of mutual funds, ETFs, and other portfolios.
Comparison with Other Market Indexes
While the S&P 500 is often seen as the most comprehensive representation of the U.S. stock market, it’s not the only major index used to track market performance. Other indexes like the Dow Jones Industrial Average (DJIA), the Nasdaq Composite, and the Russell 2000 also serve important roles, each with its own structure, focus, and weighting methodology. Comparing these indexes helps investors understand the unique perspective each one offers and how they differ in terms of market coverage, sectors represented, and calculation techniques.
Here’s a side-by-side comparison of the S&P 500 and other popular U.S. market indexes:
| Index | Number of Companies | Weighting Method | Primary Focus | Key Features |
| S&P 500 | ~500 | Float-adjusted Market Cap | Large-cap U.S. companies | Represents ~80% of U.S. market cap, includes all sectors |
| Dow Jones (DJIA) | 30 | Price-weighted | Blue-chip industrial leaders | Oldest index; heavily influenced by higher-priced stocks |
| Nasdaq Composite | 3,000+ | Market Cap | Tech-heavy, includes global firms | Dominated by technology stocks; includes non-U.S. companies |
| Russell 2000 | 2,000 | Market Cap | Small-cap U.S. companies | Reflects performance of smaller, growth-oriented businesses |
| Wilshire 5000 | ~3,500 | Market Cap | Broad U.S. market | Often called “total market index,” includes nearly all stocks |
 How to Invest in the S&P 500
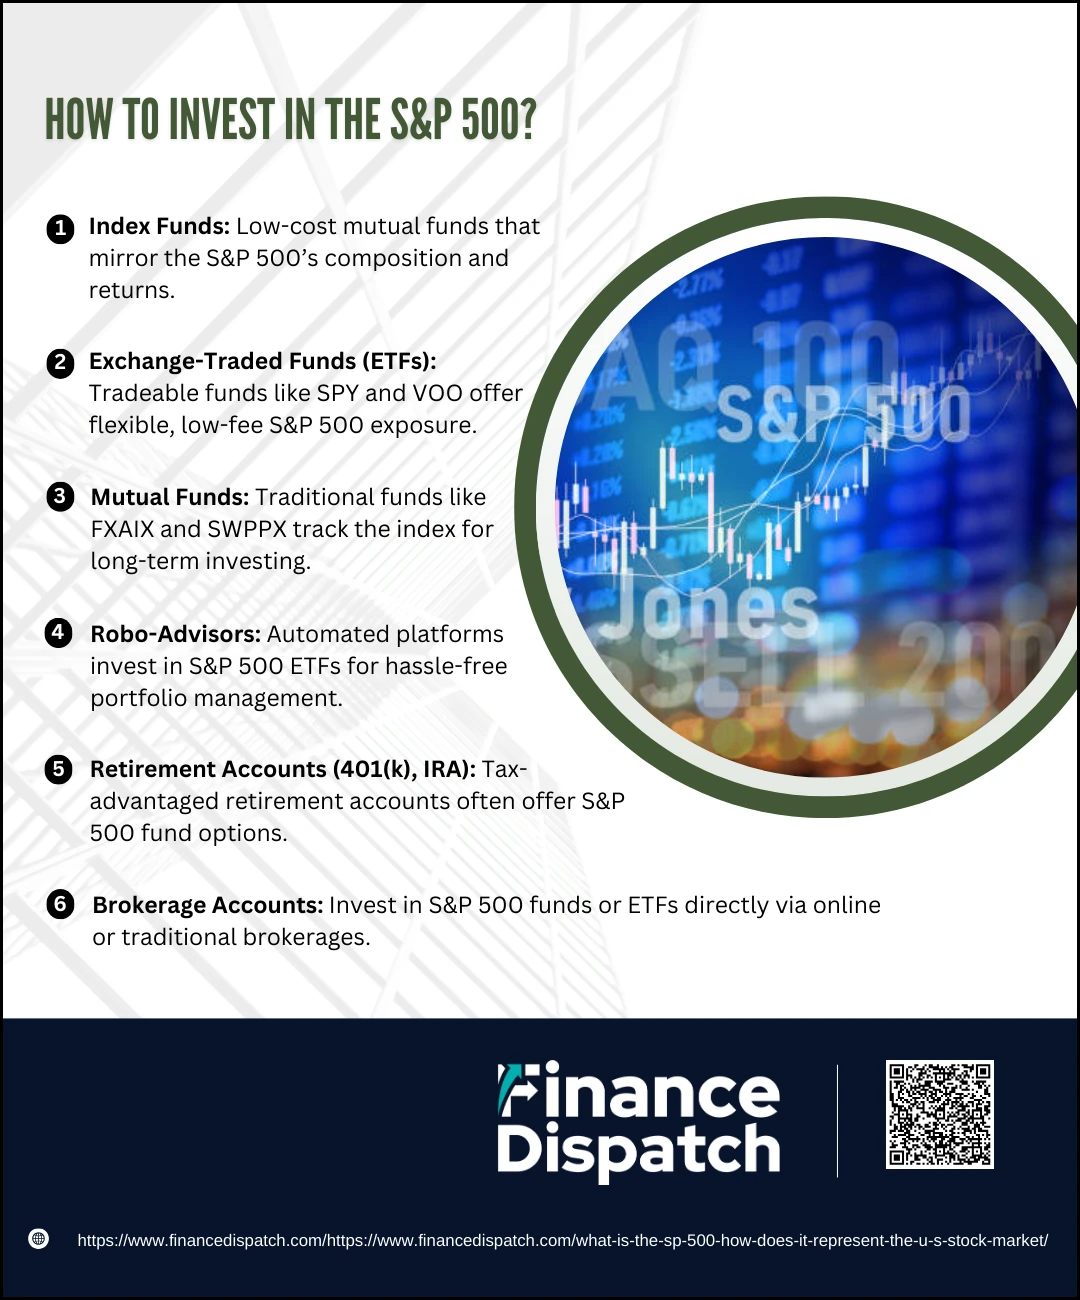
Investing in the S&P 500 is one of the most accessible and reliable ways to build long-term wealth. Since the index reflects the performance of around 500 of the largest and most influential U.S. companies, buying into it means gaining exposure to a diversified slice of the American economy. While you can’t purchase the index itself, you can invest in financial products that are designed to mirror its performance. These products make it possible to own a small piece of every company in the index with just a single investment—ideal for those who want broad market exposure without picking individual stocks.
Here are the most common and effective ways to invest in the S&P 500:
1. Index Funds
Index funds are mutual funds built to replicate the S&P 500. They invest in the same companies in the same proportions as the index. Because they are passively managed, these funds typically have lower fees than actively managed ones. They’re a solid choice for investors looking for a straightforward, cost-efficient way to track the market’s long-term growth.
2. Exchange-Traded Funds (ETFs)
ETFs like SPDR S&P 500 ETF (SPY), Vanguard S&P 500 ETF (VOO), and iShares Core S&P 500 ETF (IVV) are very popular. They function like mutual funds but trade on stock exchanges, so you can buy and sell them throughout the day. ETFs are favored for their flexibility, liquidity, and low expense ratios.
3. Mutual Funds
Mutual funds that track the S&P 500, such as the Fidelity 500 Index Fund (FXAIX) or Schwab S&P 500 Index Fund (SWPPX), are ideal for long-term investors. These funds usually require minimum investment amounts and are often available through retirement accounts or investment firms.
4. Robo-Advisors
Robo-advisors like Betterment or Wealthfront automatically invest your money in a diversified portfolio that often includes S&P 500 ETFs. These platforms manage rebalancing and reinvesting dividends, making them a convenient option for hands-off investors who prefer a fully automated experience.
5. Retirement Accounts (401(k), IRA)
Many retirement plans include S&P 500 index funds as a core investment option. Investing through a 401(k) or IRA not only gives you access to market growth but also comes with tax advantages, such as tax-deferred or tax-free growth, depending on the account type.
6. Brokerage Accounts
For maximum control and flexibility, you can invest in S&P 500 index funds or ETFs through a traditional or online brokerage account. Platforms like Vanguard, Fidelity, Schwab, Robinhood, and E*TRADE offer easy access to these funds, and some even allow you to buy fractional shares if you’re starting with a smaller amount of money.
 Benefits of Investing in the S&P 500
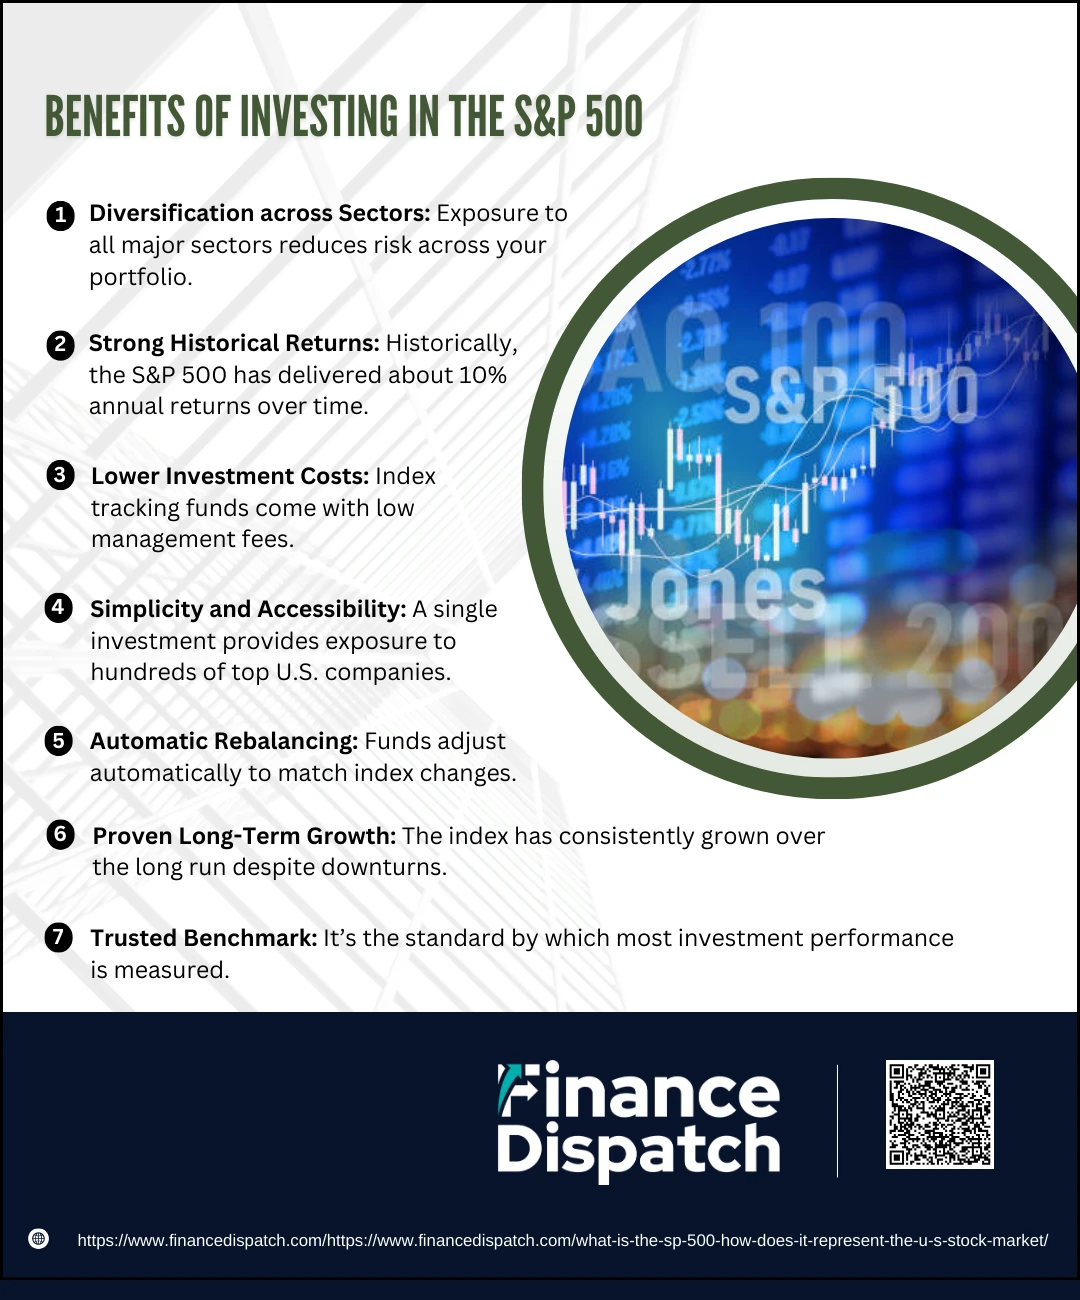
Investing in the S&P 500 is widely considered one of the most effective ways to grow wealth steadily over time. This index doesn’t just give you access to a single company—it gives you exposure to around 500 of the most powerful and influential corporations in the United States, spanning every major industry. Whether you’re new to investing or a seasoned expert, putting your money in the S&P 500 offers a combination of stability, performance, and simplicity that few other investments can match. It’s also a favorite among financial advisors and retirement planners because of its strong historical returns and low maintenance structure.
Here are the key benefits of investing in the S&P 500:
1. Diversification Across Sectors
The S&P 500 includes companies from all major sectors such as technology, healthcare, consumer goods, financials, energy, and more. This wide spread of industries helps cushion your investment—if one sector underperforms, others may offset the losses, reducing overall portfolio risk.
2. Strong Historical Returns
Over nearly a century, the S&P 500 has averaged about a 10% annual return (including dividends). While returns can fluctuate year to year, the long-term trend has been upward, making it one of the most reliable growth investments available.
3. Lower Investment Costs
Most S&P 500 index funds and ETFs are passively managed, which means they come with very low fees. Lower costs mean more of your money is working for you instead of being spent on fund management.
4. Simplicity and Accessibility
Investing in the S&P 500 doesn’t require deep financial expertise. A single purchase of an index fund or ETF instantly gives you a slice of the entire index, making it a perfect entry point for new investors who want to avoid picking individual stocks.
5. Automatic Rebalancing
The funds that track the S&P 500 automatically update their holdings whenever the index changes. This ensures that your portfolio stays aligned with the current market landscape without any manual adjustments on your part.
6. Proven Long-Term Growth
Even through recessions, bear markets, and global crises, the S&P 500 has historically recovered and continued to grow. This resilience makes it ideal for long-term goals like retirement savings, where patience and consistency pay off.
7. Trusted Benchmark
The S&P 500 is used as the gold standard benchmark for comparing the performance of portfolios, mutual funds, and individual investments. It’s the yardstick against which most other U.S. stock investments are measured.
 Risks and Limitations of S&P 500
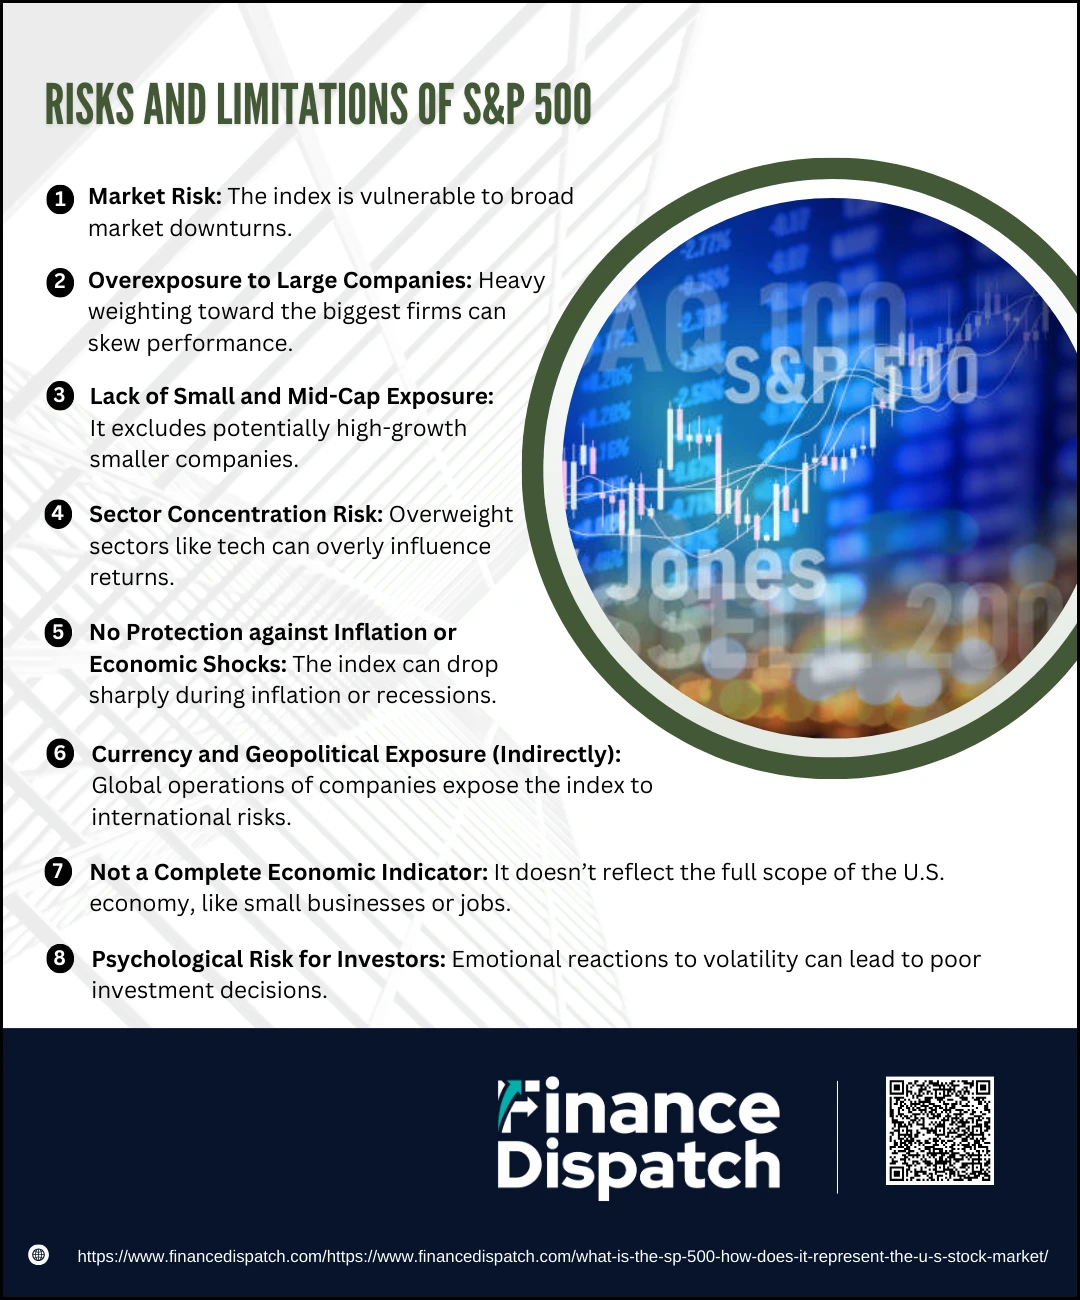
While the S&P 500 is often praised for its strong historical performance and broad market exposure, it’s not without its drawbacks. Like any investment, it carries certain risks and limitations that investors should understand before diving in. Relying solely on the S&P 500 can leave you overexposed to large-cap companies and vulnerable to market-wide downturns. Understanding these potential downsides is essential for building a balanced investment strategy that aligns with your goals and risk tolerance.
Here are some of the main risks and limitations of investing in the S&P 500:
1. Market Risk
Because the index represents large-cap U.S. stocks, its value can fluctuate significantly with changes in market sentiment, global events, or economic data. A broad market downturn will almost certainly drag the S&P 500 down as well.
2. Overexposure to Large Companies
The S&P 500 is weighted by market capitalization, meaning the largest companies have the most influence on the index’s performance. A few tech giants, for example, can disproportionately drive the index, which may limit the benefits of diversification.
3. Lack of Small and Mid-Cap Exposure
The index focuses solely on large-cap companies, leaving out smaller firms that might offer higher growth potential. This limits your exposure to the full spectrum of the U.S. stock market.
4. Sector Concentration Risk
Certain sectors—like technology—can dominate the index due to the high market value of companies within them. If that sector performs poorly, it can weigh heavily on the entire index’s performance.
5. No Protection against Inflation or Economic Shocks
While stocks tend to outpace inflation over the long term, the S&P 500 offers no built-in protection against rising costs or economic downturns. In periods of high inflation or recession, the index may experience sharp declines.
6. Currency and Geopolitical Exposure (Indirectly)
Many S&P 500 companies operate globally. While this can be a strength, it also means the index is indirectly affected by international risks, such as currency fluctuations, trade tensions, or geopolitical instability.
7. Not a Complete Economic Indicator
Although it’s often used as a proxy for the U.S. economy, the S&P 500 doesn’t include private companies, small businesses, or employment data—so it doesn’t tell the full story of economic health.
8. Psychological Risk for Investors
Sharp market dips can trigger panic selling. Even though the S&P 500 typically rebounds over time, emotional reactions during market volatility may lead investors to lock in losses by selling too soon.
The S&P 500 as an Economic Indicator
The S&P 500 is often viewed as a leading indicator of the U.S. economy because it reflects investor expectations about future corporate earnings, economic growth, and overall business conditions. Since the index is composed of large, influential companies from all major sectors, its performance provides insight into the health of the corporate world and the broader market. When the S&P 500 rises, it typically signals optimism about the economy; when it falls, it may indicate growing concerns about factors like inflation, interest rates, or geopolitical tensions. Policymakers, analysts, and investors closely watch the index to gauge economic momentum, making it a vital tool for understanding where the economy might be headed.
Conclusion
The S&P 500 stands as one of the most trusted and widely used tools for understanding the U.S. stock market and the overall health of the economy. By tracking the performance of 500 of the largest and most influential American companies across all major sectors, it offers investors a clear and comprehensive view of market trends. Whether you’re looking to invest for the long term, benchmark your portfolio, or simply stay informed about the financial landscape, the S&P 500 provides a reliable foundation. While it comes with certain risks and limitations, its historical performance, diversification, and role as an economic indicator make it a valuable asset for anyone seeking to navigate the world of investing with confidence.